A chart that shows you the trade, not just the price.
The problem: the call is in one place, the chart in another
For most of my 18 years the routine looked the same. A setup gets posted somewhere, a chat, an email, a screenshot. Then you open your charting app, find the market, and type the entry, stop and target in by hand. One wrong digit on the stop and the whole trade is a different trade.
Worse, you can never see how the last calls on that market actually played out. Did the last long hit its target? Did the stop sit in a sensible place? You are trading the next one blind.
What the Desk chart does instead
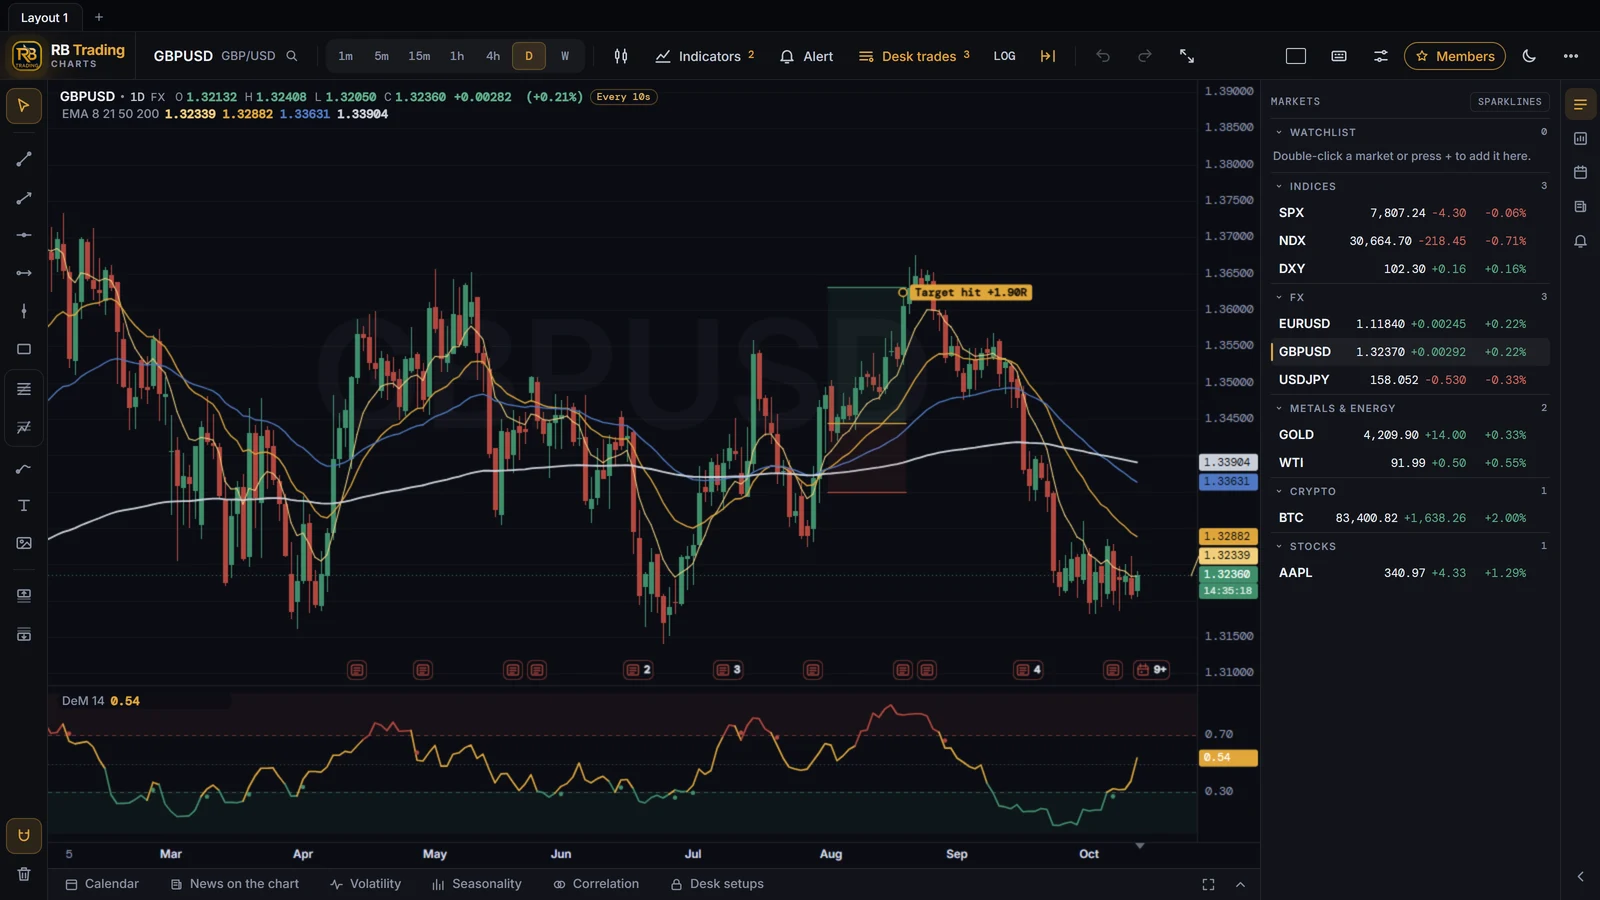
- Every Desk trade is already drawn. Entry in gold, the stop and target in their own colours, with the risk and reward shaded so you can see the trade's shape at a glance.
- Closed trades keep their result. "Target hit +1.90R", "Closed by hand +2.26R", "Stopped −1R". Every one stays on the chart, winners and losers, so you learn what our setups look like on that market.
- The tools we actually trade with are built in. The 8, 21, 50 and 200 EMAs, our DeMarker zones and the RB ATR stop bands, already set the way I use them.
- Alerts from the chart. Tap a level, choose above or below, and you get an email and a push the moment price gets there.
- Every market, side by side. Stocks, forex, metals, oil, crypto and indices, full history, and up to four charts on one screen.
Why it helps you make money, not just look at charts
A plan you can see is a plan you follow. When the stop is drawn before you enter, you size the position from it instead of guessing. When the last five calls on a market are on the chart with their results, you know what normal looks like, so a losing trade does not shake you out of the next good one.
And because the levels come straight from the board, there is nothing to copy. The trade you see is the trade we called.
Get the setups, the chart, the alerts and the record
Every Sunday: swing setups across stocks, forex and crypto with the entry, stop and target decided before the open, drawn on the chart, with alerts the moment a level hits.
Get this week's setupsEvery trade, winners and losers see the full record →
FAQ
Is this TradingView?
No. It is our own chart, built into the Trade Desk, so it can draw the Desk's trades and results on it. If you prefer TradingView, our indicators are available there too.
Can free users see the trades on the chart?
Free users see closed trades and their results on every market. The live trade's entry, stop and target are for members, because that is what the membership pays for.
Which markets are on it?
US stocks, forex majors and crosses, gold, silver, WTI oil, the main indices and the main cryptocurrencies, with full daily history.
Does it work on my phone?
Yes. The chart has its own phone layout with the drawing tools, indicators and alerts one tap away, and the Desk menu stays at the bottom so you can always step back out.