+54.5R across 111 trades
with all 54 losers left in.
Every $1 lost was matched by $2.10 won. Over eleven months and 111 closed trades, 54 of them lost money, and the run still finished 54.5R ahead, because the winners averaged roughly twice the size of the losers. This is the Substack record: every trade called for Inside the Trade subscribers since the desk began publishing to members, each with its real fill and real stop, nothing typed up afterwards from memory. I have been trading for 18 years. This record starts the day I began publishing on Substack: every trade in it I took myself and called for subscribers in real time. It counts the swing trades and the long-term portfolio holds once they close; a hold that is still open is never counted. Results are in R (multiples of the risk taken) because R can't be inflated by position size the way a percentage return can. Open positions are not on this page, counting unrealised winners is how records get flattered, and live trades belong to members.
Updated every Sunday. Last updated 4 Oct 2026.
111 closed trades: 55 won, 54 lost, and 2 scratches closed at 0R, which counts as neither. The win rate is 55 of 111, 50%. Of the total, swing trades made +51.9R and long-term portfolio holds +2.6R from 3 closes; 15 more holds are still running and are not counted.
How 54 losses still added up to a profit
A win rate on its own tells you nothing, it only means something next to the size of the wins and losses. This run finished ahead because the winners were bigger than the losers, not because there were more of them:
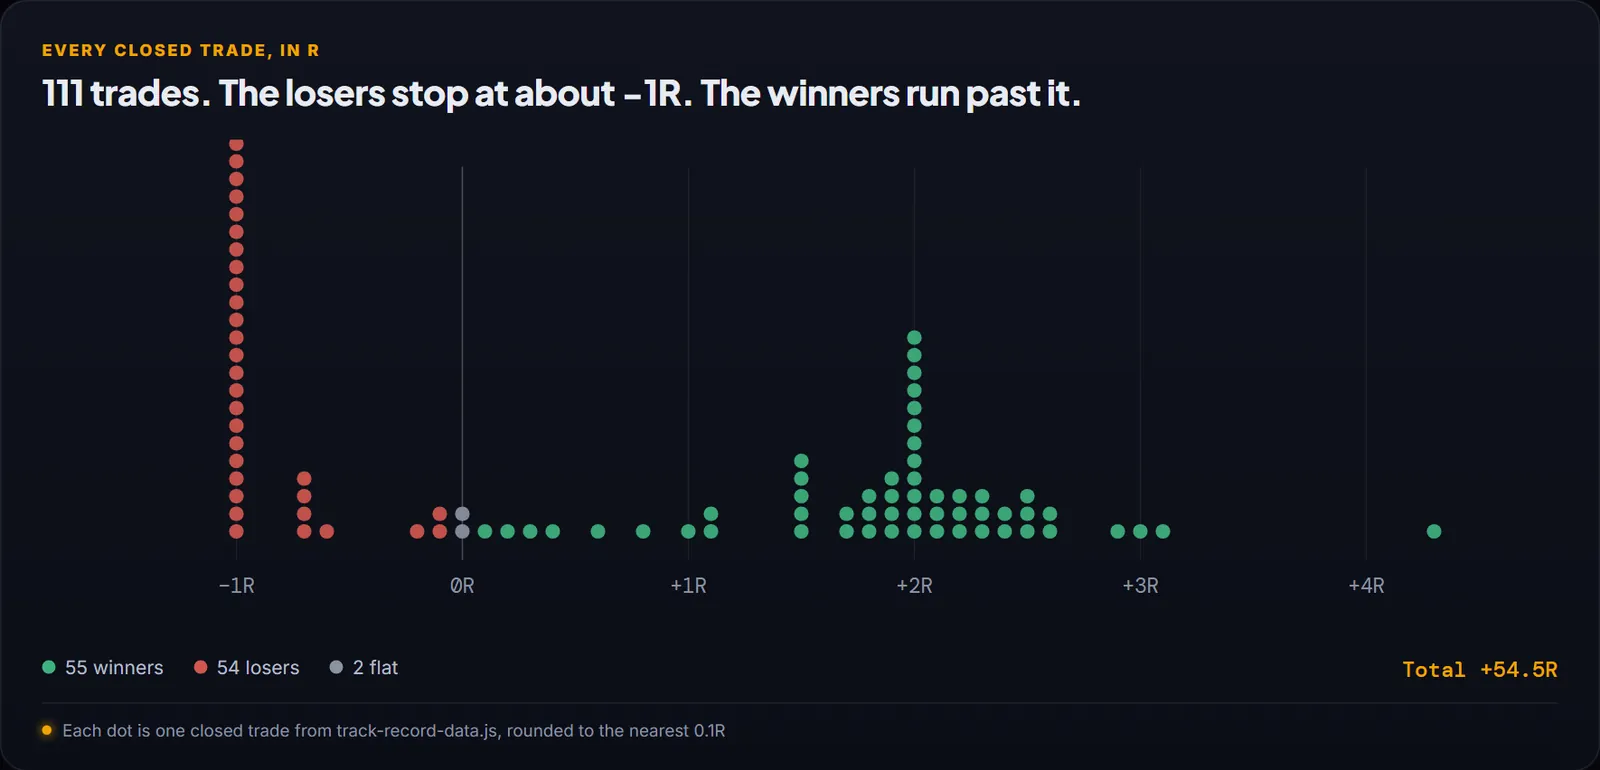
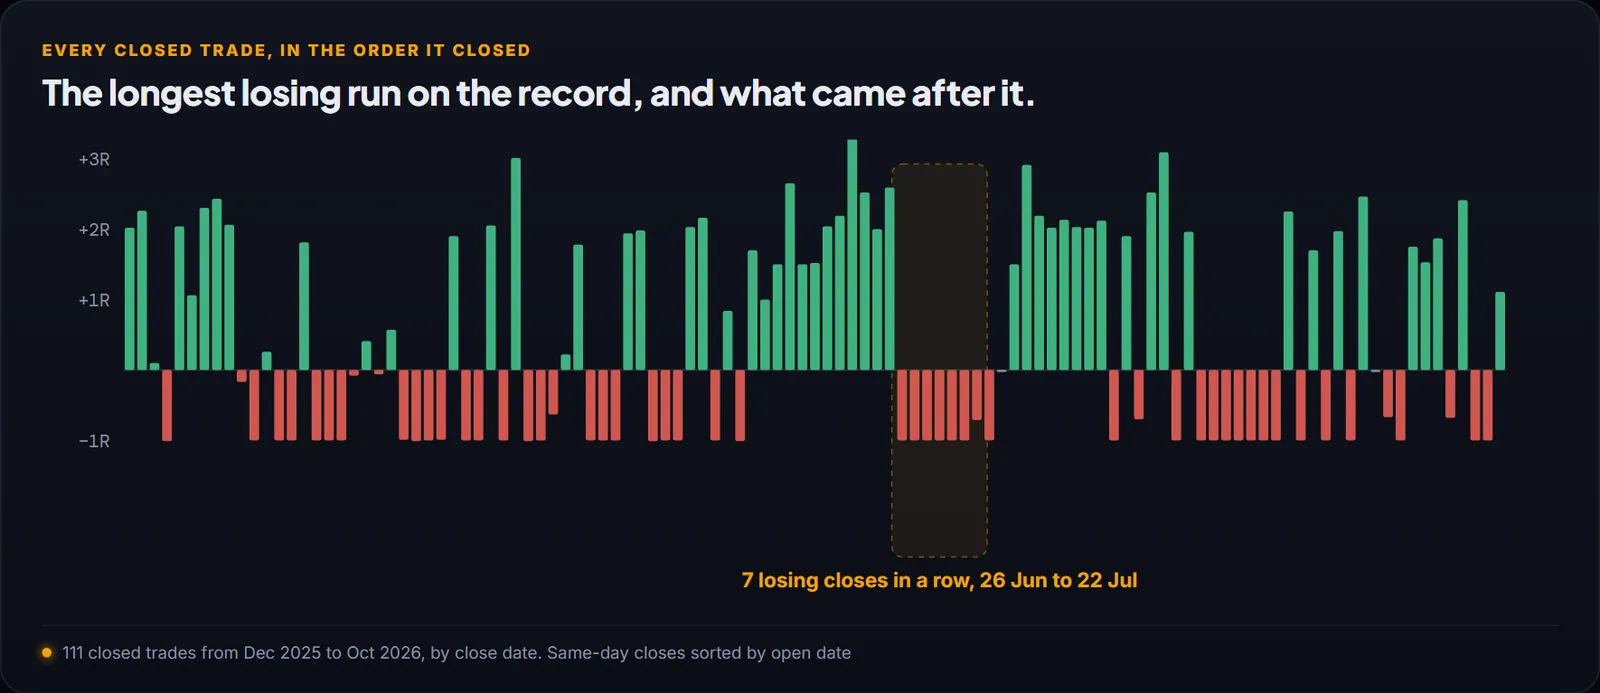
It is a thin margin, and it is why the stop matters more than the entry. A trader with a win rate like this one who lets losers run past their stop is in far more danger than this run was. It also means the losing runs are survivable but not comfortable: the worst was 7 losing trades back to back, and the deepest peak-to-trough dip was −7.0R. Both are on the curve below rather than smoothed away.
The most recent closes
The latest desk calls to close, already counted in every figure on this page. The losers from the same stretch are in here too, not tidied away.
Open right now
Positions the desk is currently holding. Levels are withheld deliberately, the entry, stop and target on a live trade are what members are paying for. None of these count toward a single figure on this page, and they never will until they close.
The portfolio, still running No leverage · 200-week vs 50-week EMA · months, not days
The 200-week Builder positions and the portfolio buys: a different strategy from the swing board, held for months, never leveraged. Open holds are not counted in any figure above. The open R is where each hold stands against the risk it was opened with, refreshed on Sundays. When a hold closes it is booked in the ledger below and counts in the record, under Portfolio.
The method behind these is written up in full, free to read: the 200-week moving average strategy.
The standouts, both directions
Biggest winners and the worst loss, side by side. Showing one without the other is how records mislead.
Where the R came from
Split by market, so you can see which parts of the method carried the run and which cost money. Portfolio is the long-term holds, counted once they close.
These came out of the same weekly setups members get
The stock and squeeze names, the forex levels, the daily bias, published before the open, with the entry, stop and target already mapped. What you see above is what happened when they were traded.
See this week's setups →Every closed trade
| Column | What it means |
|---|---|
| Opened | The day the trade was entered. |
| Entry, Stop, Target | The levels the trade was entered with. The stop is the one the R is measured against, even if it was moved later. |
| Closed, Result | The day it closed and how: target hit, stopped, or closed early. |
| R | What the trade made or lost as a multiple of its risk: a full stop is about −1R. How R works. |
Filter it however you like, including Losers, which is the filter worth spending your time on.
| Opened | Asset | Dir | Entry | Stop | Target | Closed | Result | R |
|---|---|---|---|---|---|---|---|---|
| 31 Aug 2026 | VERAShort Squeeze | Long | 34 | 30.5 | 42 | 2 Oct 2026 | Stopped | −1.00R |
| 1 Sept 2026 | META, first halfPortfolio | Long | long-term hold, levels for members | 2 Oct 2026 | Closed early | +1.11R | ||
| Long-term hold. A 2.22R move on half of the position, so it books +1.11R. | ||||||||
| 13 Jul 2026 | NVDASwing Setups | Long | 204 | 187 | 235 | 1 Oct 2026 | Closed early | +1.53R |
| Closed by hand at $230, short of the $235 target, for +1.53R. | ||||||||
| 28 Jul 2026 | TSLASwing Setups | Long | 303 | 273 | 406 | 1 Oct 2026 | Closed early | +1.87R |
| Closed by hand at $359 for +1.87R. | ||||||||
| 31 Aug 2026 | AMDSwing Setups | Long | 470.61 | 412.85 | 672 | 1 Oct 2026 | Closed early | +2.41R |
| Closed by hand at $610 for +2.41R. | ||||||||
| 10 Aug 2026 | RIVNSwing Setups | Long | 16 | 14.1 | 20 | 1 Oct 2026 | Closed early | −0.68R |
| Closed by hand at $14.70, before the $14.10 stop, for -0.68R. | ||||||||
| 24 Sept 2026 | EUR/CHFForex | Long | 0.93922 | 0.93573 | 0.9515 | 1 Oct 2026 | Stopped | −1.00R |
| 17 Sept 2026 | GBP/AUDForex | Long | 1.885 | 1.873 | 1.906 | 30 Sept 2026 | Target hit | +1.75R |
| 8 Sept 2026 | AUD/CADForex | Long | 0.9945 | 0.98737 | 1.0155 | 29 Sept 2026 | Stopped | −0.67R |
| The stop had been trailed from 0.98737 to 0.98974; R is measured from the original stop. | ||||||||
| 23 Sept 2026 | CORZShort Squeeze | Long | 18.72 | 16.42 | 22.78 | 29 Sept 2026 | Stopped | −1.00R |
| 24 Jul 2026 | NFLXSwing Setups | Long | 70 | 63.84 | 86 | 28 Sept 2026 | Closed early | 0.00R |
| Stop had been moved to break-even; exited flat when it came back. | ||||||||
| 22 Jun 2026 | MSFT, first halfPortfolio | Long | long-term hold, levels for members | 24 Sept 2026 | Closed early | +2.46R | ||
| Long-term hold. A 4.91R move on half of the position, so it books +2.46R. | ||||||||
| 6 Jul 2026 | MCDPortfolio | Long | long-term hold, levels for members | 23 Sept 2026 | Stopped | −1.00R | ||
| Long-term hold from the 200-week builder. | ||||||||
| 18 Aug 2026 | AAPLSwing Setups | Long | 306 | 288 | 341.5 | 22 Sept 2026 | Target hit | +1.97R |
| 25 Aug 2026 | DLOShort Squeeze | Long | 15.5 | 14.28 | 18 | 16 Sept 2026 | Stopped | −1.00R |
| 4 Sept 2026 | EUR/USDForex | Short | 1.1636 | 1.1695 | 1.1515 | 15 Sept 2026 | Closed early | +1.70R |
| Closed by hand at +1.70R, short of the target, with the pair oversold. | ||||||||
| 1 Sept 2026 | AMZNSwing Setups | Long | 255 | 247.5 | 283.8 | 15 Sept 2026 | Stopped | −1.00R |
| 7 Sept 2026 | GBP/NZDForex | Long | 2.2976 | 2.2806 | 2.3358 | 14 Sept 2026 | Target hit | +2.25R |
| 21 Aug 2026 | BEAMShort Squeeze | Long | 29.25 | 26.15 | 36.9 | 8 Sept 2026 | Stopped | −1.00R |
| 25 Aug 2026 | USD/CADForex | Long | 1.387 | 1.3774 | 1.4059 | 4 Sept 2026 | Stopped | −1.00R |
| 20 Aug 2026 | CLSKShort Squeeze | Long | 12.72 | 10.81 | 17.39 | 2 Sept 2026 | Stopped | −1.00R |
| 19 Aug 2026 | EUR/CADForex | Long | 1.611 | 1.6057 | 1.622 | 1 Sept 2026 | Stopped | −1.00R |
| 3 Aug 2026 | GBP/CADForex | Long | 1.8859 | 1.87099 | 1.916 | 1 Sept 2026 | Stopped | −1.00R |
| 7 Jul 2026 | NIOShort Squeeze | Long | 4.95 | 4.27 | 6.22 | 1 Sept 2026 | Stopped | −1.00R |
| 12 Aug 2026 | IRENShort Squeeze | Long | 44 | 35.6 | 61 | 28 Aug 2026 | Stopped | −1.00R |
| 19 Aug 2026 | NZD/USDForex | Long | 0.5879 | 0.5824 | 0.5987 | 21 Aug 2026 | Target hit | +1.96R |
| 20 Jul 2026 | BTCCrypto | Long | 63,800 | 61,100 | 70,600 | 20 Aug 2026 | Target hit | +2.52R |
| 1 Aug 2026 | ETHCrypto | Long | 1,850 | 1,685 | 2,360 | 20 Aug 2026 | Target hit | +3.09R |
| 19 Aug 2026 | SEIShort Squeeze | Long | 61.3 | 54 | 79 | 20 Aug 2026 | Stopped | −1.00R |
| 3 Aug 2026 | GBP/USDForex | Long | 1.34445 | 1.335 | 1.3632 | 19 Aug 2026 | Target hit | +1.90R |
| 17 Aug 2026 | EUR/GBPForex | Short | 0.85555 | 0.8585 | 0.85 | 19 Aug 2026 | Stopped | −0.70R |
| Entry dated to the Monday open the published setup specified. | ||||||||
| 28 Jul 2026 | DLOShort Squeeze | Long | 15 | 13.72 | 17.51 | 18 Aug 2026 | Stopped | −1.00R |
| 31 Jul 2026 | SAILShort Squeeze | Long | 15.98 | 14.16 | 19.84 | 13 Aug 2026 | Target hit | +2.12R |
| 4 Aug 2026 | PATHShort Squeeze | Long | 13.1 | 11.95 | 15.42 | 12 Aug 2026 | Target hit | +2.02R |
| 3 Aug 2026 | TWSTShort Squeeze | Long | 97.5 | 84 | 124.85 | 12 Aug 2026 | Target hit | +2.03R |
| 26 Jul 2026 | AUD/USDForex | Long | 0.69556 | 0.69 | 0.7074 | 8 Aug 2026 | Target hit | +2.13R |
| 29 Jun 2026 | AMZNShort Squeeze | Long | 234.95 | 217.16 | 273.85 | 4 Aug 2026 | Target hit | +2.19R |
| 22 Jul 2026 | MMEDShort Squeeze | Long | 16.44 | 15.19 | 18.97 | 4 Aug 2026 | Target hit | +2.02R |
| 13 Jul 2026 | MSFTSwing Setups | Long | 385 | 352 | 481 | 3 Aug 2026 | Target hit | +2.91R |
| Dates corrected 4 Oct 2026 from the daily candles: called on the 12 Jul board, filled at $385 on Mon 13 Jul, target $481 first hit on 3 Aug. The levels and R were always right. | ||||||||
| 26 Jul 2026 | GBP/AUDForex | Short | 1.95 | 1.96 | 1.895 | 1 Aug 2026 | Closed early | +1.50R |
| Closed early into news rather than holding the full target. | ||||||||
| 19 Jul 2026 | BIRKShort Squeeze | Long | 43.65 | 39.31 | 52.47 | 1 Aug 2026 | Stopped | −1.00R |
| 19 Jul 2026 | EUR/AUDForex | Short | 1.6455 | 1.66 | 1.6202 | 1 Aug 2026 | Closed early | 0.00R |
| Stop had been moved to break-even; exited flat when it came back. | ||||||||
| 22 Jun 2026 | TSLAShort Squeeze | Long | 406.58 | 362.07 | 493.6 | 22 Jul 2026 | Closed early | −0.71R |
| 2 Jul 2026 | ASTSShort Squeeze | Long | 85.17 | 63.64 | 117.85 | 16 Jul 2026 | Stopped | −1.00R |
| 6 Jul 2026 | BEAMShort Squeeze | Long | 36.77 | 32 | 46.9 | 14 Jul 2026 | Stopped | −1.00R |
| 6 Jul 2026 | NTLAShort Squeeze | Long | 16.54 | 13.91 | 25.61 | 14 Jul 2026 | Stopped | −1.00R |
| 27 Jun 2026 | WOLFShort Squeeze | Long | 58.15 | 41.85 | 90.85 | 2 Jul 2026 | Stopped | −1.00R |
| 1 Jun 2026 | FLNCShort Squeeze | Long | 23.4 | 17.05 | 38 | 2 Jul 2026 | Stopped | −1.00R |
| 15 Jun 2026 | QUBTShort Squeeze | Long | 11 | 8.9 | 15.24 | 26 Jun 2026 | Stopped | −1.00R |
| 15 Apr 2026 | HIMSShort Squeeze | Long | 23.09 | 18.28 | 35.56 | 17 Jun 2026 | Target hit | +2.59R |
| 14 Apr 2026 | RHIShort Squeeze | Long | 26.2 | 23 | 32.6 | 12 Jun 2026 | Target hit | +2.00R |
| 11 May 2026 | ASTSShort Squeeze | Long | 77.6 | 60.78 | 120 | 26 May 2026 | Target hit | +2.52R |
| 30 Apr 2026 | LUNRShort Squeeze | Long | 25.39 | 21.11 | 43.97 | 26 May 2026 | Target hit | +4.34R |
| 13 Apr 2026 | CLSKShort Squeeze | Long | 10.81 | 8.76 | 15.29 | 20 May 2026 | Target hit | +2.19R |
| 25 Mar 2026 | SATSShort Squeeze | Long | 117.51 | 103.48 | 146.2 | 18 May 2026 | Target hit | +2.04R |
| 13 May 2026 | ESMFutures | Long | 7,407 | 7,382 | none | 13 May 2026 | Closed early | +1.52R |
| New York session volume momentum. Intraday. | ||||||||
| 6 May 2026 | MESFutures | Long | 7,341.25 | 7,324.08 | none | 6 May 2026 | Closed early | +1.50R |
| New York session. Intraday. | ||||||||
| 5 May 2026 | ESMFutures | Long | 7,273 | 7,261 | none | 5 May 2026 | Closed early | +1.50R |
| Intraday. The journal holds two cards for this fill, counted once here. | ||||||||
| 5 May 2026 | CAD/CHFForex | Short | 0.57463 | 0.57681 | none | 5 May 2026 | Closed early | +2.65R |
| Date shown is the entry date from the journal card; the exit date is not on the card. | ||||||||
| 8 Apr 2026 | EUR/AUDForex | Short | 1.65792 | 1.67153 | 1.63159 | 21 Apr 2026 | Closed early | +1.00R |
| 13 Apr 2026 | EUR/USDForex | Long | 1.17194 | 1.16574 | 1.18534 | 17 Apr 2026 | Closed early | +1.70R |
| 16 Apr 2026 | GBP/CADForex | Long | 1.85956 | 1.85263 | 1.87356 | 16 Apr 2026 | Stopped | −1.01R |
| 24 Mar 2026 | EUR/GBPForex | Long | 0.86577 | 0.86136 | 0.8744 | 14 Apr 2026 | Closed early | +0.84R |
| 2 Mar 2026 | CRKShort Squeeze | Long | 20.17 | 17.81 | 25.16 | 9 Apr 2026 | Stopped | −1.00R |
| 3 Apr 2026 | EUR/CADForex | Long | 1.60719 | 1.60203 | 1.61835 | 8 Apr 2026 | Target hit | +2.16R |
| 26 Mar 2026 | EUR/AUDForex | Long | 1.66393 | 1.65559 | 1.68093 | 31 Mar 2026 | Target hit | +2.03R |
| 10 Mar 2026 | FLNCShort Squeeze | Long | 16.71 | 13.16 | 29 | 30 Mar 2026 | Stopped | −1.00R |
| 16 Mar 2026 | CORZShort Squeeze | Long | 17 | 15.44 | 20.14 | 27 Mar 2026 | Stopped | −1.00R |
| 25 Mar 2026 | EUR/USDForex | Long | 1.16008 | 1.15546 | 1.17011 | 26 Mar 2026 | Stopped | −1.01R |
| 17 Mar 2026 | USD/CADForex | Long | 1.36964 | 1.36498 | 1.37893 | 25 Mar 2026 | Target hit | +1.98R |
| 5 Mar 2026 | GBP/NZDForex | Long | 2.26493 | 2.24726 | 2.29914 | 23 Mar 2026 | Target hit | +1.94R |
| 20 Feb 2026 | BEAMShort Squeeze | Long | 28.31 | 24.91 | 35.25 | 13 Mar 2026 | Stopped | −1.00R |
| 9 Mar 2026 | GBP/AUDForex | Long | 1.90333 | 1.88672 | 1.9335 | 10 Mar 2026 | Stopped | −1.00R |
| 24 Feb 2026 | CRSPShort Squeeze | Long | 57.21 | 52 | 68 | 10 Mar 2026 | Stopped | −1.00R |
| 2 Mar 2026 | AUD/CADForex | Short | 0.96535 | 0.97466 | 0.94882 | 9 Mar 2026 | Target hit | +1.78R |
| 3 Feb 2026 | EUR/NZDForex | Long | 1.95215 | 1.92918 | 2.02657 | 4 Mar 2026 | Closed early | +0.22R |
| 2 Feb 2026 | EUR/NZDForex | Long | 1.97334 | 1.94834 | none | 4 Mar 2026 | Closed early | −0.63R |
| 24 Feb 2026 | ENPHShort Squeeze | Long | 47.79 | 42 | 73 | 27 Feb 2026 | Stopped | −1.00R |
| 23 Feb 2026 | USD/CADForex | Long | 1.36922 | 1.36465 | 1.38268 | 27 Feb 2026 | Stopped | −1.01R |
| 17 Feb 2026 | KSSShort Squeeze | Long | 19.82 | 17.42 | 24.72 | 25 Feb 2026 | Stopped | −1.00R |
| 25 Feb 2026 | NFLXShort Squeeze | Long | 82.8 | 74.2 | none | 25 Feb 2026 | Closed early | +3.01R |
| DeM daily trigger. Date shown is the entry date from the journal card; the exit date is not on the card. | ||||||||
| 12 Feb 2026 | EUR/USDForex | Short | 1.18795 | 1.19297 | 1.1777 | 19 Feb 2026 | Target hit | +2.05R |
| 3 Feb 2026 | GBP/NZDForex | Long | 2.26307 | 2.24349 | none | 17 Feb 2026 | Stopped | −1.00R |
| 2 Feb 2026 | EUR/AUDForex | Long | 1.69631 | 1.66969 | none | 11 Feb 2026 | Stopped | −1.00R |
| 9 Feb 2026 | GBP/CADForex | Short | 1.85634 | 1.86007 | 1.84915 | 10 Feb 2026 | Target hit | +1.90R |
| 2 Feb 2026 | GBP/AUDForex | Long | 1.97384 | 1.93 | none | 9 Feb 2026 | Stopped | −0.99R |
| 5 Feb 2026 | BTC/USDCrypto | Long | 67,044.25 | 60,000 | none | 6 Feb 2026 | Stopped | −1.00R |
| 5 Feb 2026 | BTC/USDCrypto | Long | 69,960.25 | 64,371.27 | none | 5 Feb 2026 | Stopped | −1.01R |
| 2 Feb 2026 | BTC/USDCrypto | Long | 76,065.81 | 67,500 | none | 5 Feb 2026 | Closed early | −0.99R |
| 29 Jan 2026 | EUR/AUDForex | Long | 1.69269 | 1.66966 | 1.76953 | 30 Jan 2026 | Closed early | +0.41R |
| 29 Jan 2026 | EUR/NZDForex | Long | 1.96972 | 1.94996 | 2.02734 | 30 Jan 2026 | Closed early | −0.06R |
| 29 Jan 2026 | GBP/AUDForex | Long | 1.95299 | 1.93215 | 2.02531 | 30 Jan 2026 | Closed early | +0.57R |
| 7 Jan 2026 | EUR/GBPForex | Long | 0.86676 | 0.86023 | 0.88352 | 30 Jan 2026 | Closed early | −0.08R |
| 28 Jan 2026 | GBP/AUDForex | Long | 1.97037 | 1.95077 | 2.02424 | 29 Jan 2026 | Stopped | −1.00R |
| 26 Jan 2026 | EUR/NZDForex | Long | 1.98562 | 1.96933 | 2.02858 | 29 Jan 2026 | Stopped | −1.00R |
| 22 Jan 2026 | EUR/AUDForex | Long | 1.71983 | 1.69984 | 1.77825 | 28 Jan 2026 | Stopped | −1.00R |
| Corrected 4 Oct 2026 (owner): this was a -1R loss. The row had read as a target hit with the stop as its exit. | ||||||||
| 15 Jan 2026 | USD/CADForex | Short | 1.39015 | 1.40265 | 1.36685 | 26 Jan 2026 | Stopped | +1.81R |
| 21 Jan 2026 | GBP/NZDForex | Long | 2.2957 | 2.27996 | 2.34095 | 22 Jan 2026 | Stopped | −1.00R |
| 20 Jan 2026 | GBP/AUDForex | Long | 2.00198 | 1.97852 | 2.07062 | 22 Jan 2026 | Stopped | −1.00R |
| 16 Jan 2026 | EUR/USDForex | Long | 1.16176 | 1.15772 | 1.17395 | 19 Jan 2026 | Closed early | +0.26R |
| 9 Jan 2026 | GBP/USDForex | Long | 1.34221 | 1.33804 | none | 15 Jan 2026 | Stopped | −1.00R |
| 6 Jan 2026 | EUR/CADForex | Long | 1.6128 | 1.60414 | 1.63002 | 15 Jan 2026 | Closed early | −0.17R |
| 29 Dec 2025 | FLNCShort Squeeze | Long | 20.13 | 17.43 | 25.69 | 15 Jan 2026 | Target hit | +2.06R |
| 26 Dec 2025 | USD/CADForex | Long | 1.36797 | 1.36021 | none | 9 Jan 2026 | Closed early | +2.43R |
| 22 Dec 2025 | CGONShort Squeeze | Long | 40.12 | 37.68 | 45.74 | 9 Jan 2026 | Target hit | +2.30R |
| 17 Dec 2025 | USD/CADForex | Long | 1.37866 | 1.37094 | 1.40007 | 9 Jan 2026 | Closed early | +1.06R |
| 19 Dec 2025 | GBP/CADForex | Long | 1.84501 | 1.8381 | 1.85913 | 5 Jan 2026 | Target hit | +2.04R |
| 17 Dec 2025 | EUR/USDForex | Short | 1.17506 | 1.18067 | 1.16413 | 24 Dec 2025 | Stopped | −1.01R |
| 12 Dec 2025 | EUR/USDForex | Long | 1.17319 | 1.16803 | 1.1833 | 16 Dec 2025 | Closed early | +0.10R |
| 14 Nov 2025 | GBP/USDForex | Long | 1.31509 | 1.30246 | none | 16 Dec 2025 | Closed early | +2.26R |
| 24 Nov 2025 | BEAMShort Squeeze | Long | 22.6 | 20.17 | 27.51 | 4 Dec 2025 | Target hit | +2.02R |
The receipts
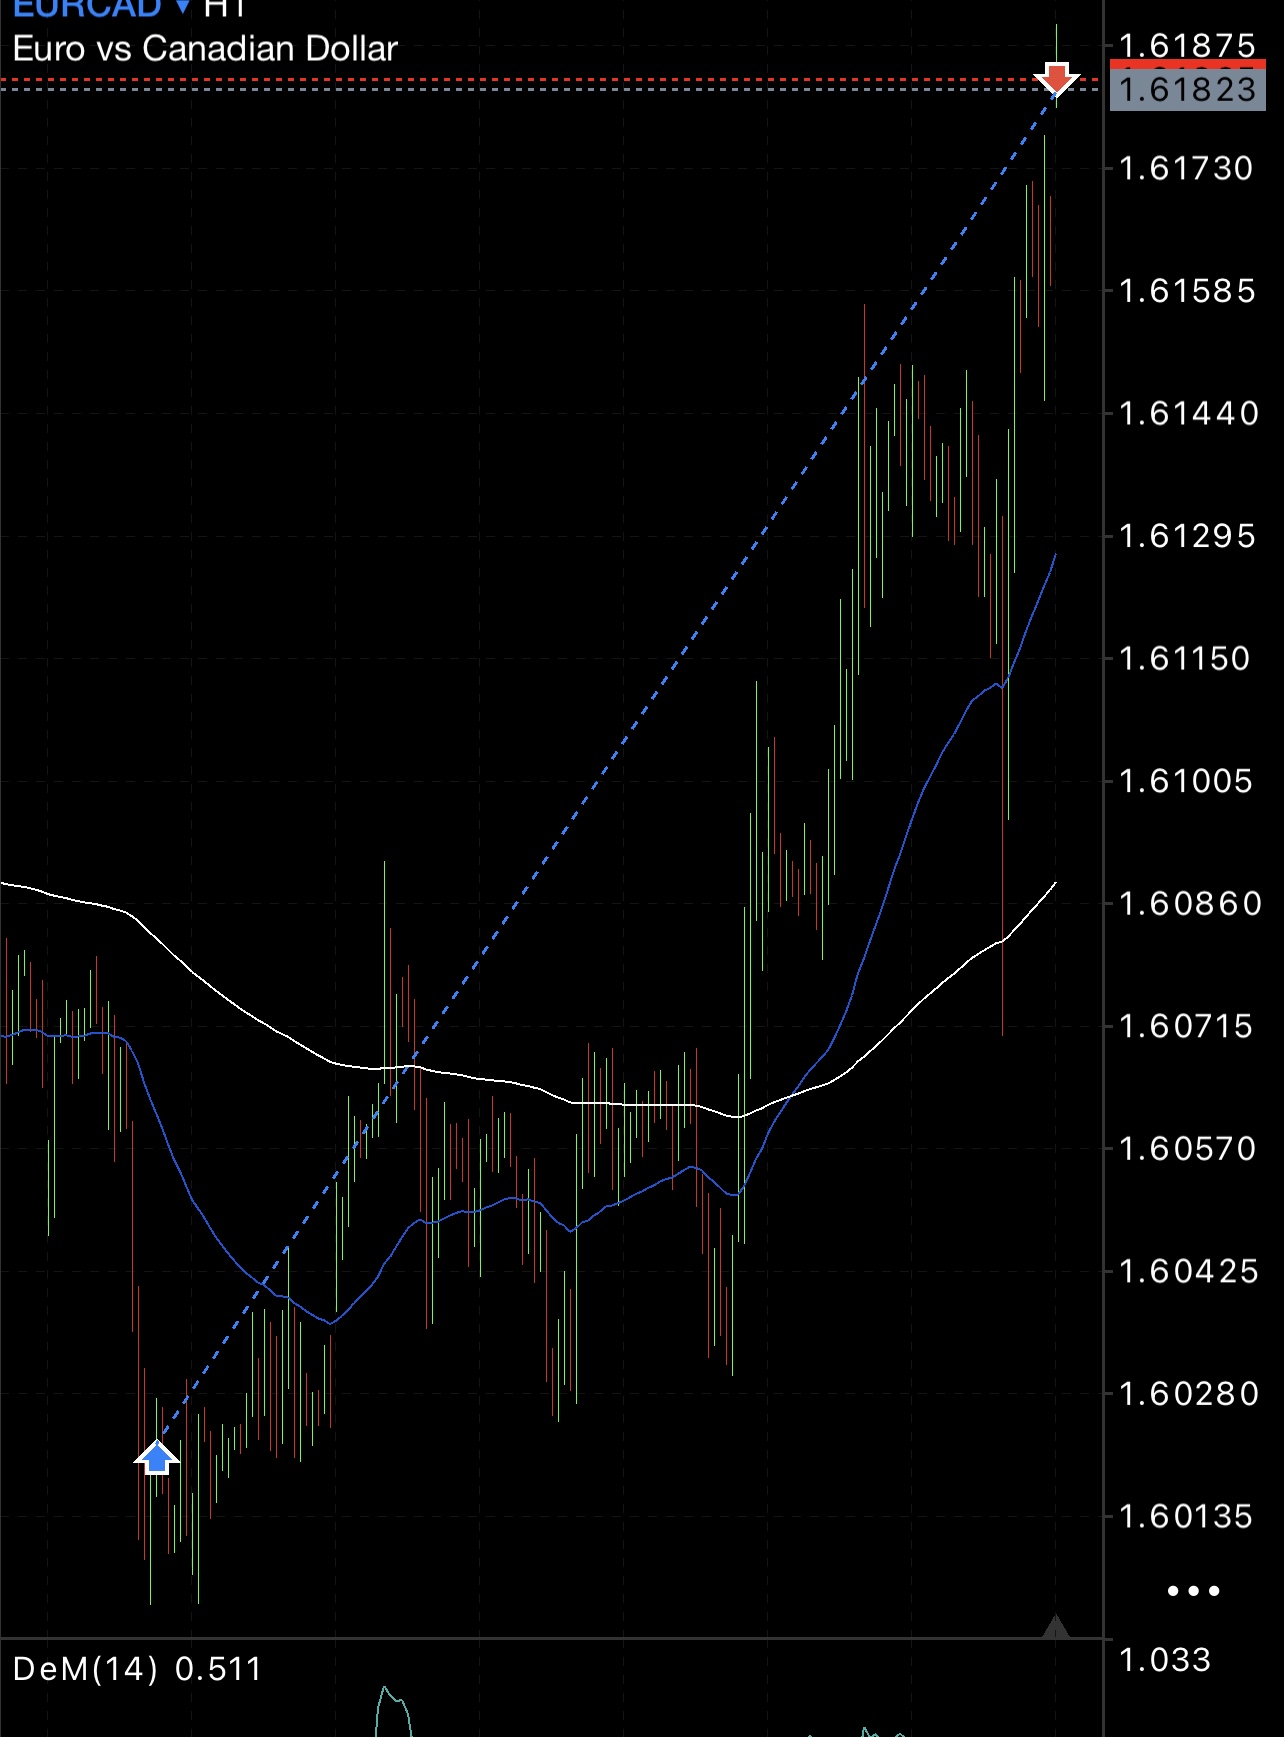
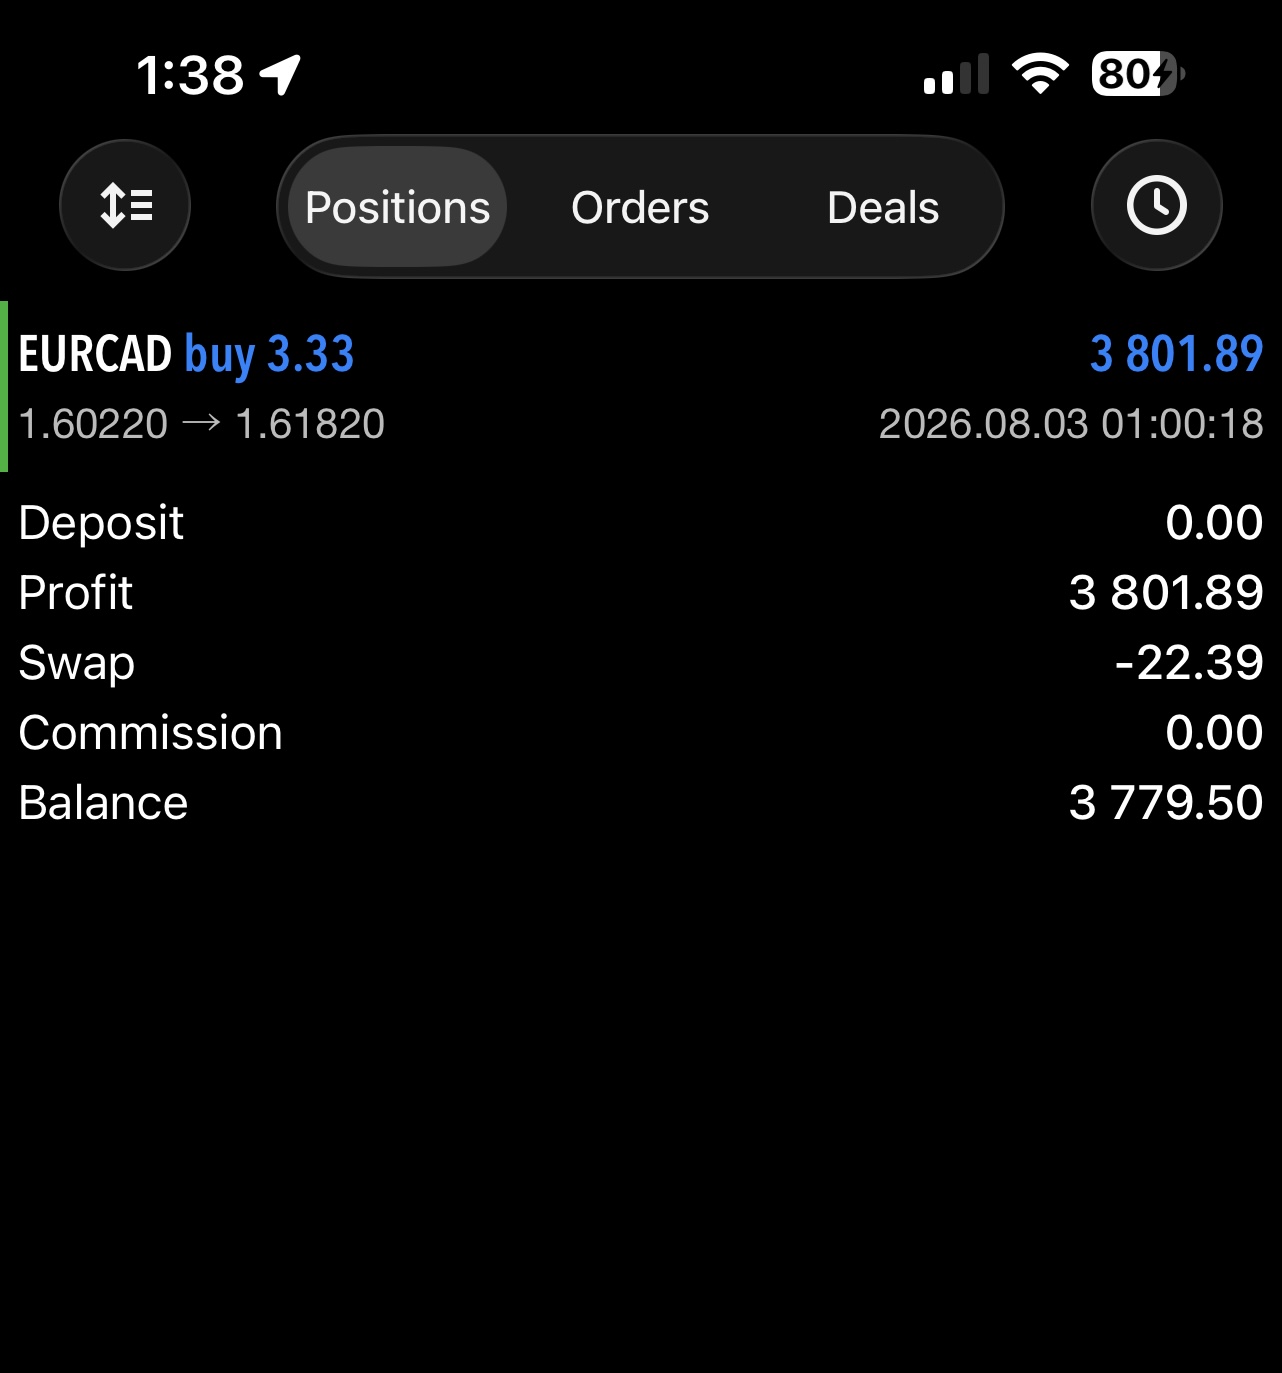
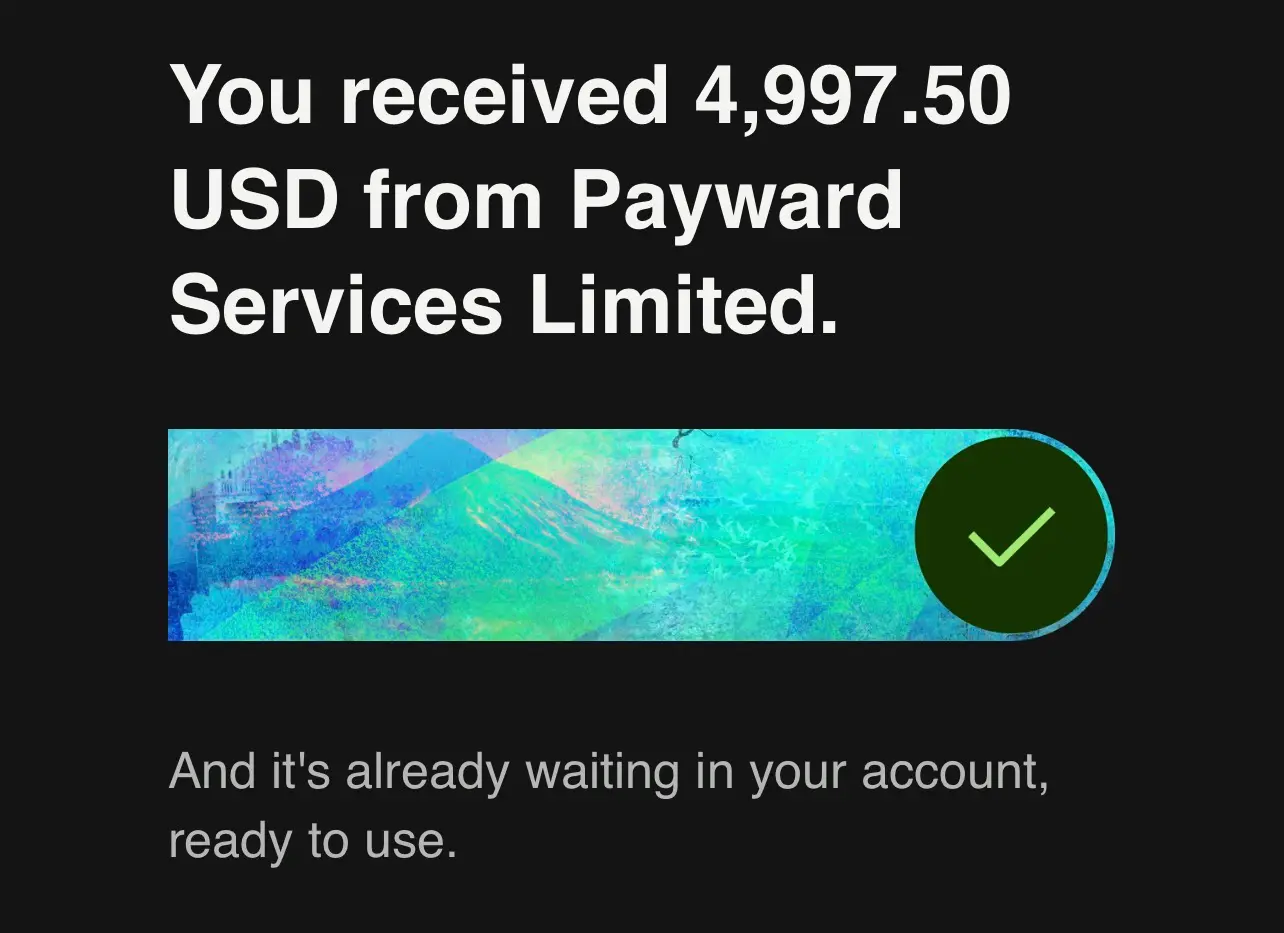
Screenshots rather than summaries, a trade from chart to settled position, a payment confirmation, and a full month of raw account history with the losing trades left in. These are from my own personal trading accounts, not the Substack record in the table above, so they are shown separately and never folded into it.
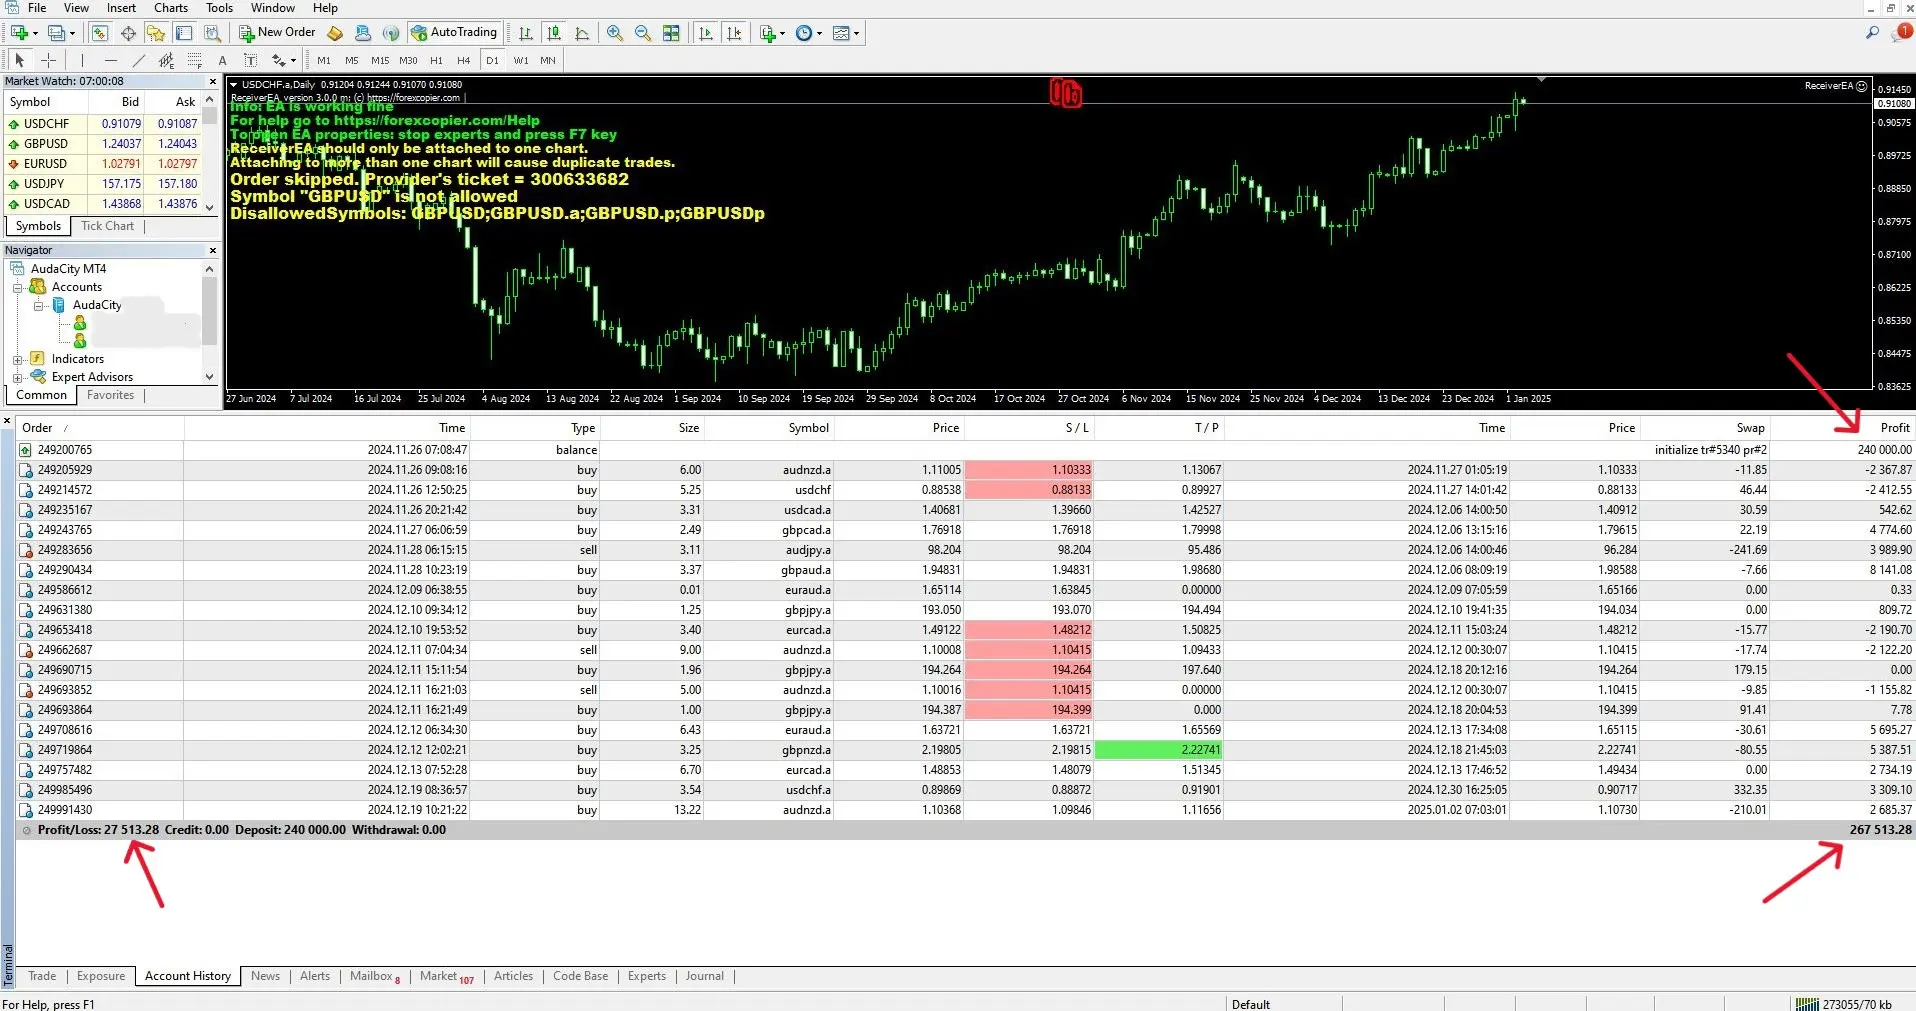
How this record is kept
A trade appears here once it has closed, target hit, stop hit, or manually exited. Open positions are never counted, for two reasons: unrealised winners flatter a record, and live positions are what members are paying for. Nothing is filtered out for being ugly, which is why a run of seven consecutive losers and a set of three straight crypto stop-outs are sitting in the table above.
R is calculated from the levels on each trade: the distance from entry to exit divided by the distance from entry to stop, inverted for shorts. A full stop-out is −1R. A stop moved to break-even or trailed into profit never changes that denominator, the risk is the risk that was taken at entry. The page recomputes every R from the entry, stop and exit shown in its own row, so if a number in the R column doesn't match the three prices next to it, the page is wrong and you should say so.
These are trades in my own account, run on the same three strategies published on the desk, the stock and squeeze names, the forex levels, and (to my cost) crypto. They come out of the journal as a block, so nothing inside the window is filtered for being ugly: the entries I sized badly and the ones I bailed out of early are all still in there. What it is not is every trade I have ever placed. It is the run I exported, over the dates shown.
This week's setups are on the desk now
The same format you see above, entry, stop, target and the reasoning behind them, published before the open across stocks, forex and crypto. Open positions and their live levels are members-only, which is precisely why they aren't on this page.
See this week's setups →FAQ
Why report in R instead of percentage returns?
Because percentages depend on how much you chose to risk, so they can be inflated by sizing. R measures the trade itself: what it made relative to what it risked. It's the honest unit, and it's how professional review is done.
Are these the results I would have made?
No. This is my account, not yours. Your fills, sizing and choices differ, and no two traders take the same set of setups. Treat it as evidence of process, not as a projection.
Why are the losers shown?
Because a record without losers isn't a record, it's an advert. Our own guide to choosing a trading service lists vanishing losing trades as a warning sign, it would be absurd to publish that and then hide our own. Filter the table by Losers and every one is there with its entry, stop and date. When a setup fails, it lands on this page the same Sunday a winner would.
Why is there no profit or loss in pounds or dollars?
Deliberately. A money column says more about the account size than about the trading, and it turns a record into an income claim, the thing every regulator and every sensible reader is right to distrust. R-multiples let you apply the record to whatever you actually risk per trade.
Is this record big enough to prove anything?
Not on its own, and anyone who says a few hundred trades prove an edge is selling something. What a record this size does show is how the process behaves: the payoff between winners and losers, the drawdowns, the losing streaks. Judge it on whether the losses stay controlled and the method stays the same, not on the total. The better test is the next trade. Members get each setup before it triggers, then see how it closed right here, win or lose.
Is this every trade you've ever taken?
No. It is the Substack record: the trades called for subscribers, starting on the first date in the table and growing every Sunday as trades close. I have been trading for 18 years; the years before Substack are not in it. Every trade here I took myself and called for subscribers in real time. Inside that window nothing is filtered out: the losers, the bad sizing and the early exits are all in the table. It isn't a lifetime record, and this page doesn't pretend to be one.