What is an R-multiple, and why serious records use it
R is your planned risk on a trade, and an R-multiple states the outcome as a multiple of that risk. Risk $100, make $200: +2R. Risk $100, get stopped: −1R. The unit strips out position size and account size, which is exactly why honest track records use it, a percentage return can be inflated by sizing; an R-multiple cannot.
The formula and the two Rs people conflate
R-multiple = (exit − entry) ÷ (entry − stop), sign-adjusted for shorts. The denominator is the planned risk, which means the number is only meaningful if a stop existed before entry. No stop, no R, no comparability; that is not pedantry, it is the entire point.
Distinguish planned R:R (the ratio a setup offers before entry: target distance over stop distance) from the realised R-multiple (what actually happened). A "3R setup" that gets stopped is a −1R trade. Confusing the promise with the result is how bad records are accidentally, or deliberately, written.
Expectancy: the whole game in one line
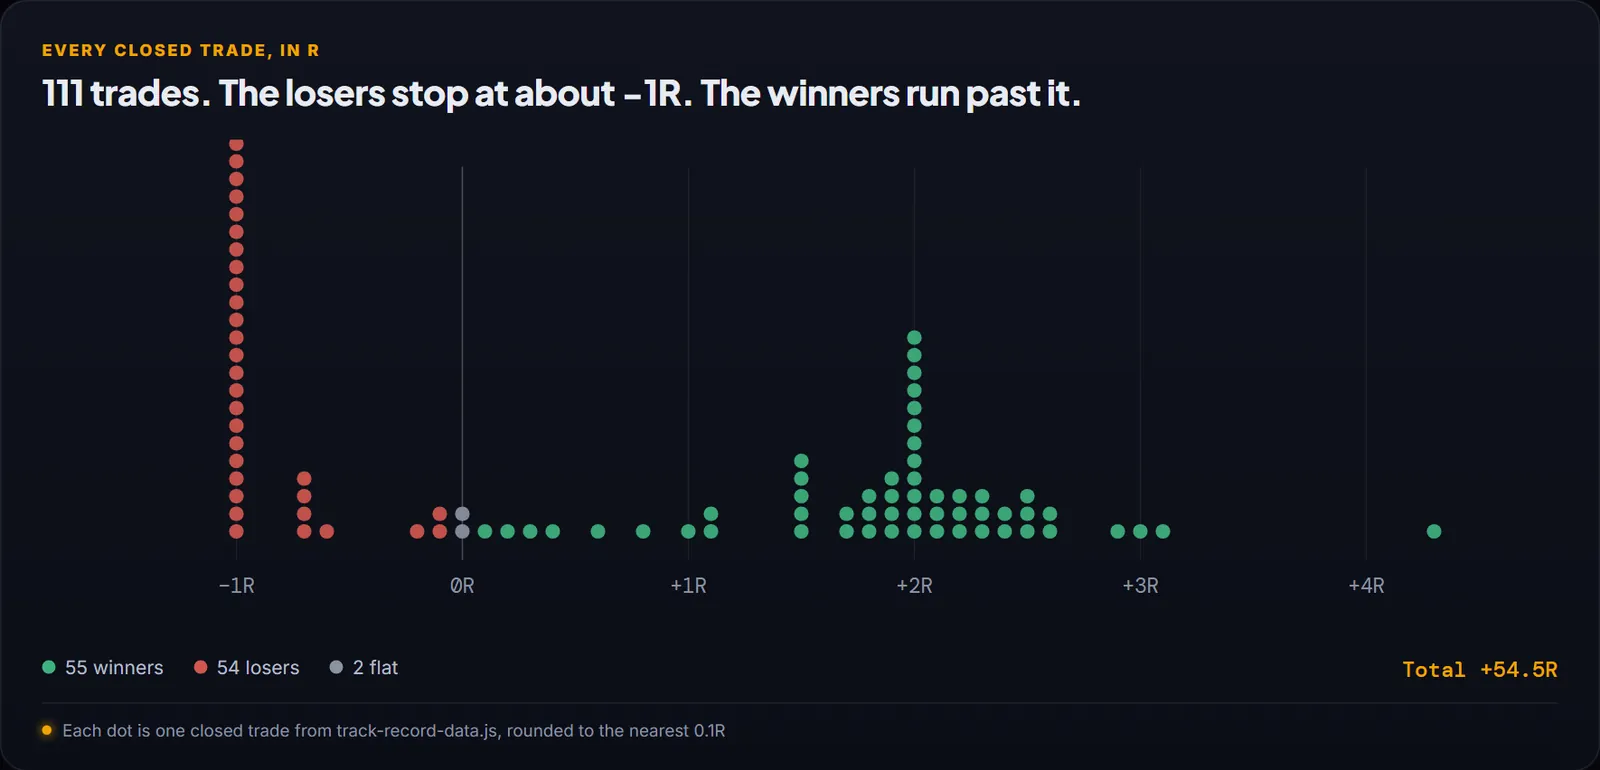
Expectancy per trade = (win rate × average win) − (loss rate × average loss), all in R. Real numbers from the published record: a 50% win rate, average winner +1.90R, average loser −0.92R gives (0.49 × 1.90) − (0.49 × 0.92) ≈ +0.49R per closed trade, which is precisely how 111 trades containing 54 losers still finished +54.5R.
The same line explains why loss containment beats win-picking: hold the average loser near −1R and a mid-40s win rate still compounds at a 2:1 payoff. Let losers drift to −2R and a 50% win rate quietly bleeds. The stop-loss guide is the practice behind that arithmetic.
Why not just use percentages?
Percent returns answer "how did the account change", a function of sizing, leverage and luck as much as skill. R answers "how good was the trading". A 40% year at 10% risk per trade and a 15% year at 1% risk are not close, and only R exposes the difference. Percent also invites the oldest flattery in the business: quoting returns on the best account, the best month, the survivor. R on a complete, dated list of trades, losers included, is the format that resists the flattery, which is why it is the only format the record on this site uses.
A real one from the record: MSFT, +2.9R
Theory is cheap, so here is the arithmetic on a real published trade. Microsoft, long from $385, stop at $352, target $481, called on the 12 July board, filled at $385 on 13 July 2026, and the target was first hit on 3 August. The planned risk (1R) was $385 − $352 = $33. The exit banked $481 − $385 = $96. So: 96 ÷ 33 = +2.91R, the trade paid nearly three times what it risked.
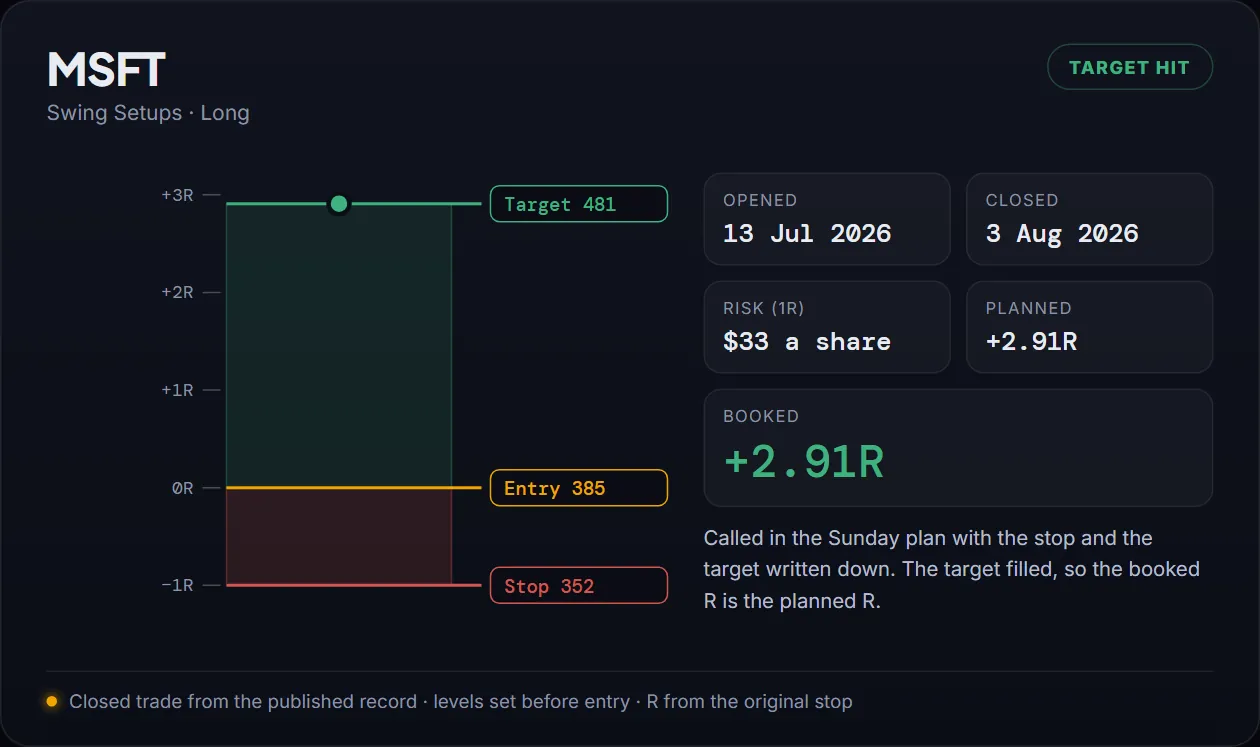
Notice what the R-multiple did there: it graded the trade without knowing the position size. Whether that was a $500 account risking $5 or a $200,000 prop account risking $2,000, the quality of the trade is identical, and that is exactly why the whole record is kept in R. To size a position from a stop in seconds, use the free position size calculator.
This week’s setups are already mapped
Every Sunday before the open: analysed swing setups across stocks, forex and crypto with the exact entry, stop and target, plus the live dashboard, three letters a week, the TradingView indicator suite and the masterclass library.
Get this week’s setups →111 trades · 54 losers shown · +54.5R see the full record →
Planned R and realised R
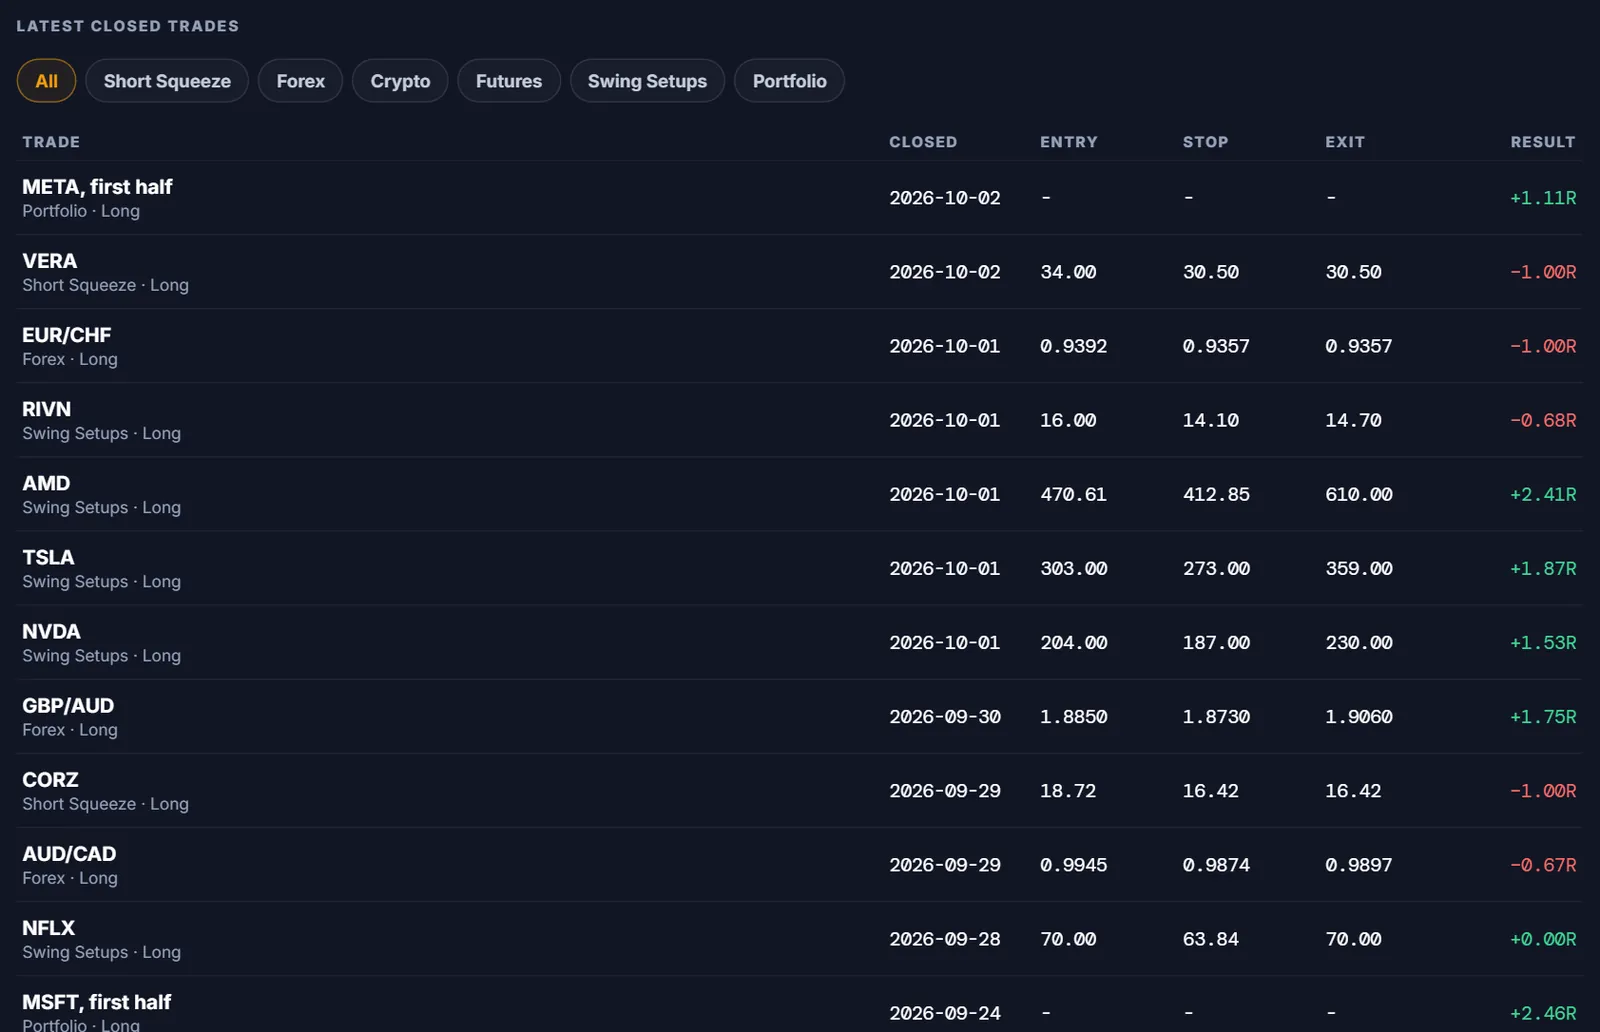
Every trade carries two R numbers. Planned R is fixed before entry: the distance to the target divided by the distance to the stop. Realised R is what the trade actually did at the exit, measured against the same stop. The record only ever counts the realised figure, and always against the stop the trade was entered with, so a stop moved later can never shrink the risk and flatter the result.
Two closed trades from the record show the gap. The EUR/USD short from 1.1636, stop 1.1695, was planned for about +2.05R at 1.1515; it was closed early at 1.15357 and booked +1.70R. The TSLA long from 406.58, stop 362.07, was planned for about +1.96R; it was closed early at 375 and booked −0.71R, a loss smaller than the full −1R the stop allowed.
FAQ
What is a good average R-multiple?
The question is really about expectancy. Anything reliably positive after costs compounds, the record behind this site runs at about +0.49R per closed trade. Chasing a high average R by holding for home runs usually just fattens the losers.
Is a minimum 1:2 risk-reward mandatory?
No single ratio is sacred: viability is payoff × win rate. A 1.5R average winner works at a 50% win rate; a 3R target that rarely fills works for nobody. What is close to mandatory is capping losers at −1R, because every combination dies once the average loss grows.
Do R-multiples include commissions and slippage?
They should, compute R on net results or your expectancy is fiction by exactly your cost rate. High-frequency approaches feel this hardest, one of the quiet arguments for lower-frequency swing trading.
How do I start tracking my trades in R?
Record entry, stop and exit for every trade, the R math falls out automatically. Any spreadsheet works; a purpose-built journal automates it (RB Trading’s journal at rbtrading.site computes R per trade natively, with a free tier).