Trade Desk › Trading glossary
The swing trading glossary, every term the desk uses, in plain English.
These are the working definitions behind the published record and the weekly setups, measurement terms first (they make a record auditable), then the desk's own vocabulary, then risk. Each entry links to the guide that goes deeper.
Measurement, the terms that make a record honest
- R-multiple (exit − entry) ÷ (entry − stop)
- A trade's result expressed as a multiple of the risk planned for it. Risk $200, make $400: that's +2R. Hit the stop: −1R. R makes a $500 account and a $500,000 account comparable, and it's the unit the entire published record is kept in. Full walkthrough: what is an R-multiple?
- Risk-reward ratio (R:R)
- The ratio a setup offers before entry: distance to target over distance to stop. A plan entering at 100 with a stop at 95 and target at 110 offers 2:1. Distinguish this from the realised R-multiple, what actually happened.
- Expectancy
- The average R a system earns per trade: (win% × avg win) − (loss% × avg loss). It is the whole game in one line, a 50% win rate with +1.90R average winners and −0.92R average losers expects about +0.49R per trade, which compounds. A 50% win rate with big losers can still expect a negative number.
- Profit factor
- Gross profit ÷ gross loss. Above 1.0 the record makes money; near 2.0 the winners are decisively outworking the losers. It's harder to flatter than win rate, because one uncapped loss drags it hard, which is why it pairs naturally with a −1R loss cap.
- Win rate
- Percentage of closed trades that made money. On its own it's the most misleading statistic in trading, sellable, but meaningless without the size of the average winner and loser next to it.
- Drawdown
- The fall from an equity peak to the following trough. Personal accounts survive drawdowns; prop firm accounts often don't, most funded programmes enforce a hard daily and overall limit, and a breach ends the account regardless of what happens next.
The desk's vocabulary
- Buy zone
- The area within roughly one weekly ATR of the 200-week EMA, considered for long-term accumulation only while the 50-week EMA holds above the 200-week (structure intact). Proximity is measured in each asset's own volatility, so "close to the line" means the same thing on a calm fund and a violent growth stock. The 200-week strategy guide covers the full method.
- 200-week EMA
- An exponential moving average over ~four years of weekly closes, a slow line price rarely visits. In long-term uptrends it has repeatedly marked the area where deep pullbacks exhausted. The Trade Desk's Portfolio Builder tracks hundreds of assets by their distance to it.
- 8/21 EMA stack
- The short-term trend read on daily charts: the 8-period EMA above the 21 says momentum is with the longs; crossing back through it is often the first exit warning. Used for swing entries, not investing decisions.
- DeMarker (DeM 14)
- A 0–1 bounded oscillator built from the last 14 periods' highs and lows. Below 0.30 = washed out, sellers exhausted, the zone-touch more likely to hold. Above 0.70 = stretched. The desk reads it weekly for accumulation and daily for swings; the DeMarker guide has the maths and the settings.
- Short squeeze
- A rally that feeds on itself as short sellers are forced to buy back stock to cap their losses. Candidates need crowding (high short interest), a reason to move, and a technical trigger, the squeeze guide shows the screen the desk runs.
- Short interest / float
- The float is the stock actually available to trade; short interest is the fraction of it currently sold short. Twenty percent-plus of the float short is crowded, kindling for a squeeze, not proof of one.
- Break-above · Close-above · Pullback trigger types
- The three entry rules every desk setup carries. Break-above fires the moment price trades through the level intraday, fastest, most exposed to fakeouts. Close-above waits for the bar to close beyond it, later entry, far fewer traps; the desk's default for daily setups. Pullback buys a retrace into a chosen level, weakness within strength, instead of chasing. Which one a setup uses is stated up front, because it changes what "triggered" means.
- Risk-on / risk-off
- A one-line regime read of how aggressive the tape rewards being: risk-on favours breakouts and growth names, risk-off favours patience and smaller size. The dashboard states its read every week rather than leaving it implied.
Risk & sizing
- The 1% rule
- Risk no more than 1% of the account on any single trade. Size from the stop: position = (account × 1%) ÷ (entry − stop). It's the arithmetic that turns a −1R loss into a survivable 1% dent, a free position size calculator does it in seconds.
- Stop-loss
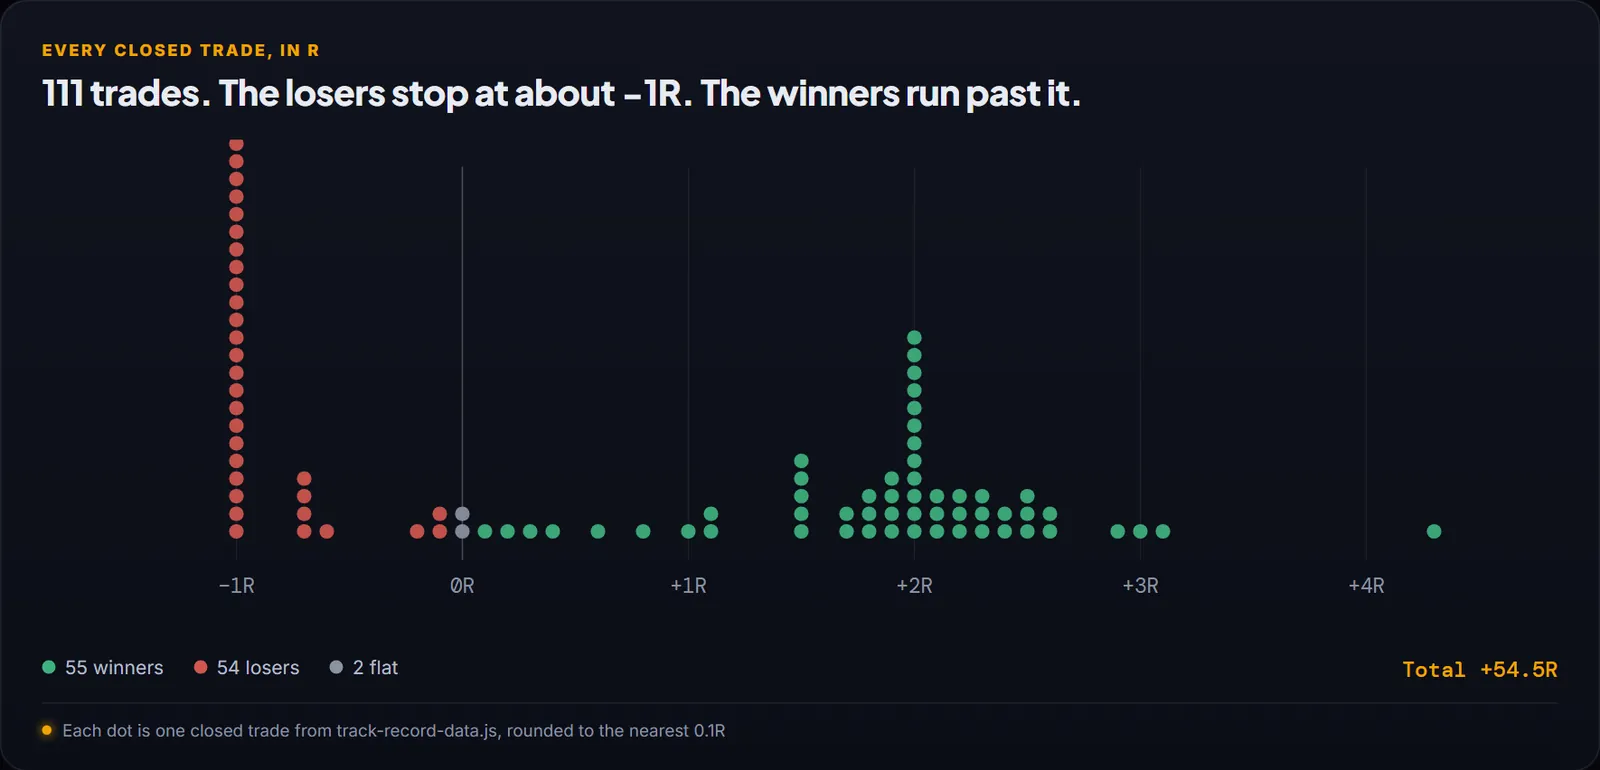
- The exit decided before entry, placed as a real order at the level where the trade idea is wrong. Everything about capping losses at −1R depends on the stop being honoured, the stop-loss guide covers placement, and every loss, published shows 111 trades of the result.
- Take-profit / partials
- The pre-planned exit on the winning side. The desk's default is scaling: bank part of the position around +2R, let the remainder run behind a trailing stop, paying the discipline bill while keeping the right tail open.
- Prop firm
- A funding company that stakes traders with firm capital after an evaluation, in exchange for a profit split, and enforces hard drawdown limits. Prop rules are why loss containment matters more for funded traders than for anyone else: one uncapped loser can end the account outright.
- The −1R cap
- The standing rule that no losing trade may cost more than the risk planned for it. Not a promise of fewer losses, a decision about what each one is allowed to cost. In 111 published trades the worst loss on this desk's record is −1.01R: the full list is public.
See the vocabulary in use, this Sunday
Every weekly setup is published with its trigger type, stop, target and R:R stated before the open. The terms above aren't theory here; they're the format.
$29/mo · or $199/yr, 20% off the annual · paid Substack letters included · cancel anytime
111 trades · 54 losers shown · +54.5R see the record →