Swing trading losing streaks: the longest run on the record, and what came after
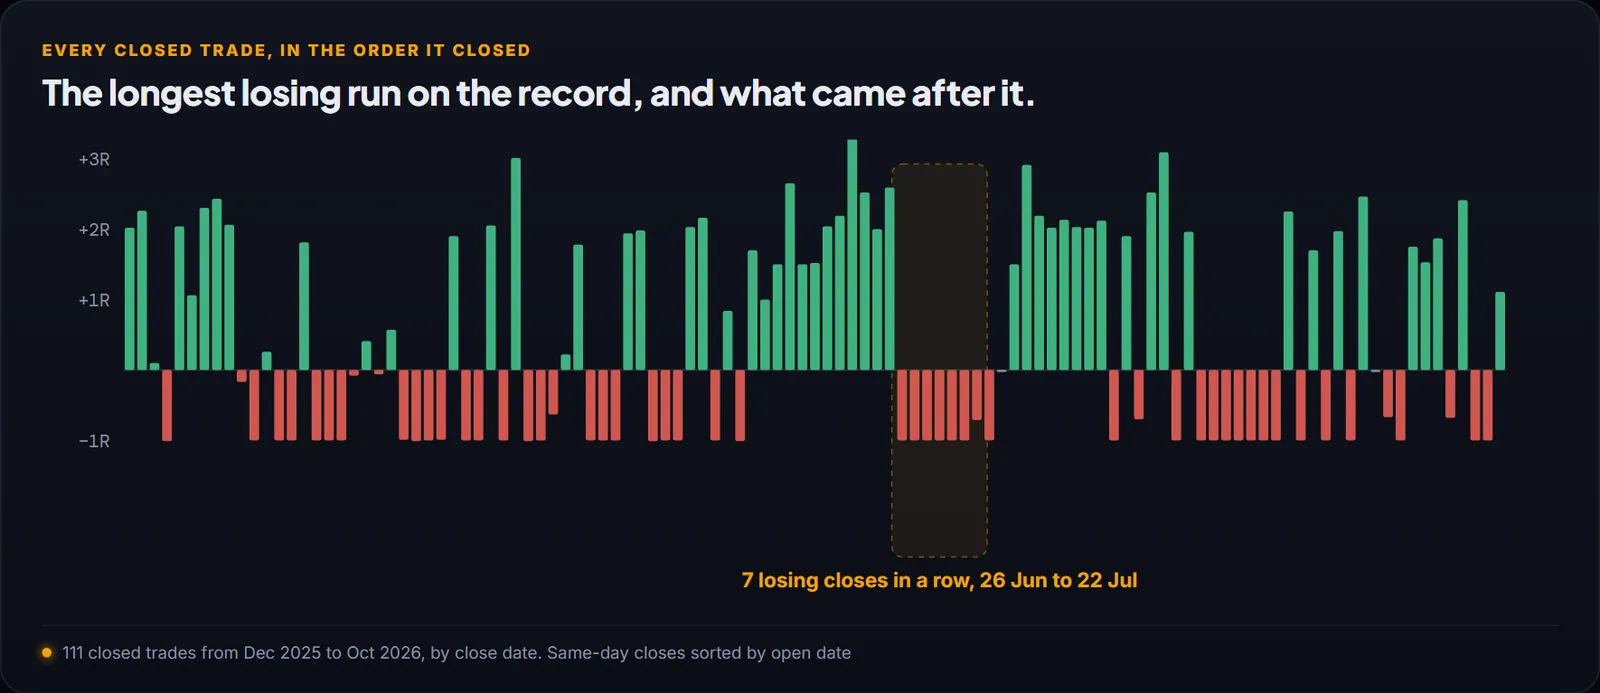
At a win rate near 50%, a run of four losses is close to certain over a hundred trades and seven in a row is entirely possible. The longest run on the Desk’s published record was seven losing closes in a row, from 26 June to 22 July 2026. Because every stop was capped at about −1R, it cost about 6.7R, and the record still stands at +54.5R across 111 closed trades.
The run, drawn
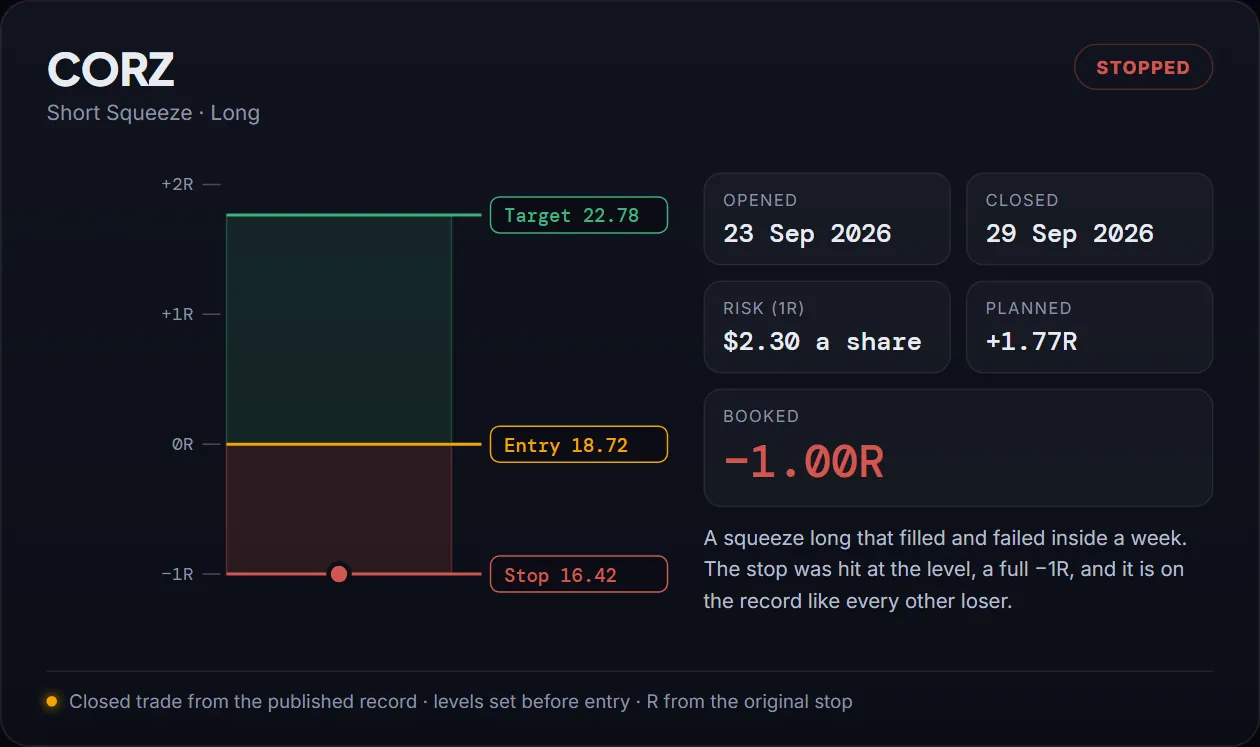
Here is every closed trade on the record in the order it closed. The seven bars in the box are QUBT, FLNC, WOLF, BEAM, NTLA and ASTS, all stopped at −1R, and the TSLA squeeze long closed by hand at −0.71R. All seven were squeeze trades, the part of the Desk with the lowest win rate. Then August came, with eleven targets hit in the month.
The maths of a streak
With a 50% win rate, the chance that any given trade starts a run of seven losers is 0.5 to the seventh power, under 1%. Across a hundred trades there are close to a hundred places for that run to start, so seeing one is not rare at all. The useful question is not "will a streak come" but "what does it cost when it does". At 1% risk per trade a seven-loss run costs about 7% of the account. At 2% it costs about 14%, and at 5% it is close to a third of the account gone and a very different recovery.
What makes a streak survivable
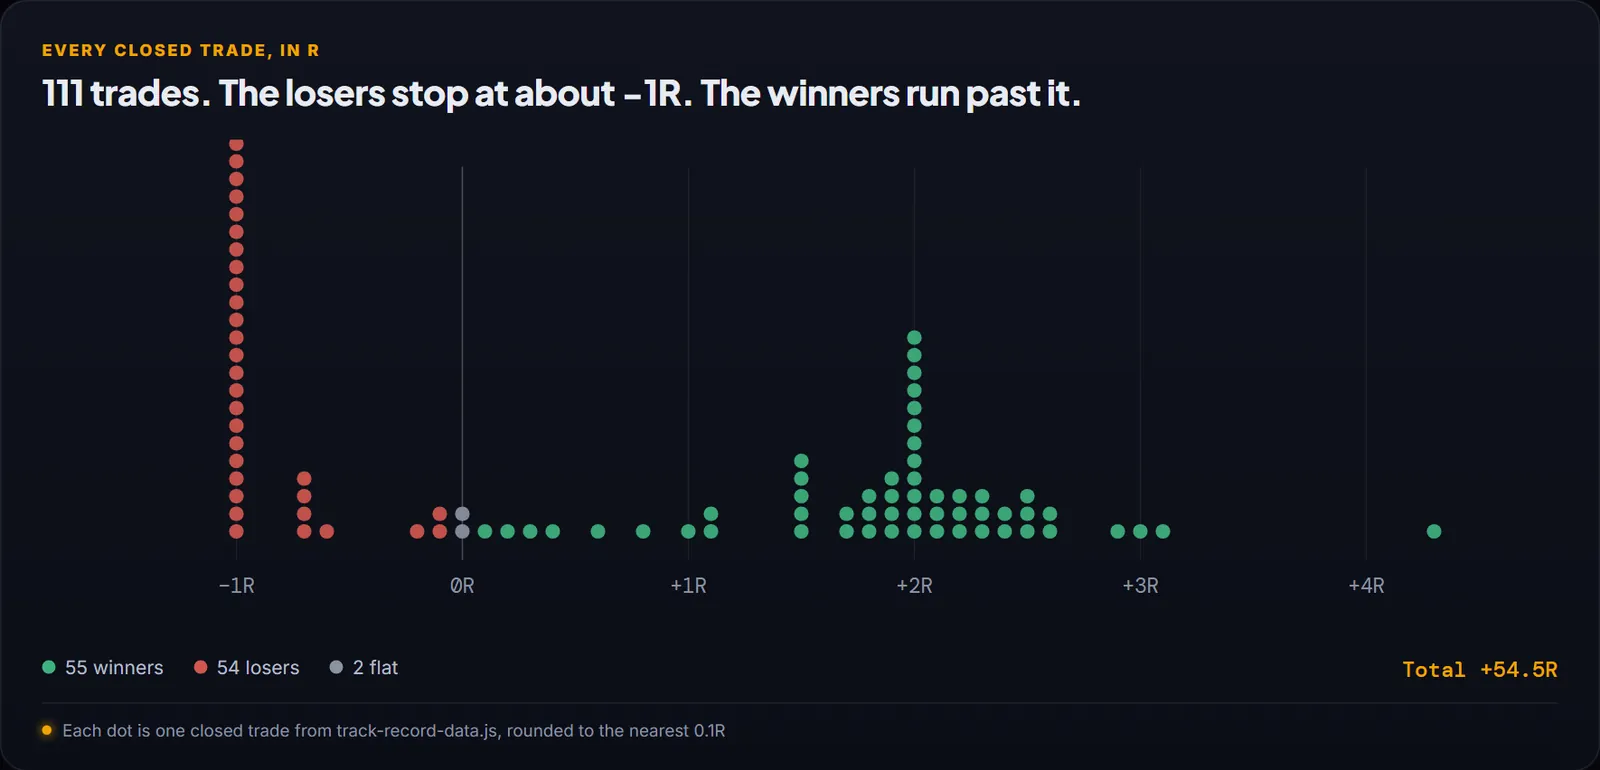
Losses capped at one unit. The worst single loss on the record is −1.01R. A streak of seven stops costs seven units; a streak of seven trades that were each allowed to run past the stop costs whatever the market decides. Size that assumes the streak. Pick risk per trade so the longest run you expect still leaves you calm, which for most people means 0.5% to 1%. No changes mid-run. Rewriting the rules after the fourth loss means the next winner is taken by a different method, and you never learn whether the original one works.
After the run
The record's deepest dip from a peak, measured by close date, was about 7.7R. It was recovered because the method did not change and the winners stayed allowed to run. The full record shows the run in context, the losing side lists every one of the 54 losers, and the prop challenge guide works out what a seven-loss run means against a 5% daily limit.
This week’s setups are already mapped
Every Sunday before the open: analysed swing setups across stocks, forex, gold and crypto with the exact entry, stop and target, an alert when one triggers, the live dashboard and the paid Substack letters.
Get this week’s setups →111 trades · 54 losers shown · +54.5R see the full record →
FAQ
How long can a losing streak last in swing trading?
At a 50% win rate, runs of four are near certain over a hundred trades and seven or more are possible. The published record’s longest run is seven losing closes in a row.
How much should I risk per trade to survive a losing streak?
Enough that the longest run you expect leaves the account and your judgement intact. At 1% risk a seven-loss run costs about 7%; most swing traders sit between 0.5% and 1%.
Should I stop trading after a losing streak?
Check that each loss was taken at the planned stop and size. If they were, the streak is the method behaving normally. If losses ran past their stops, that is the problem to fix, not the method.
What was the worst drawdown on the record?
About 7.7R from peak to trough, measured by close date. Every trade in it is on the published record.