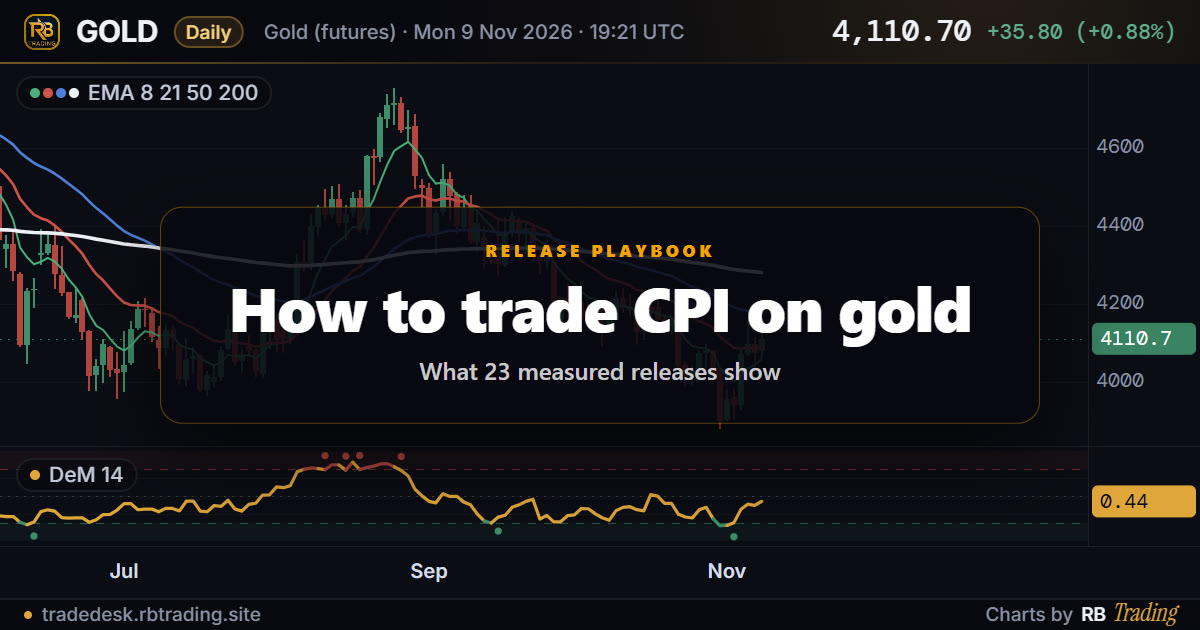
How to trade CPI news on gold
Plan around the print. Over the last 23 US CPI releases, gold moved a median 0.24% in the first 30 minutes and 0.51% after 4 hours, and the first move held to the close on only 12 of 22. Set levels and stops before 8:30 New York (13:30 UK), wider than the typical 0.85% first-hour range.
- Gold’s CPI history before every print
- The news calendar in your time zone
- Email only, no card
- About 55¢ a day
- Weekly setups: entry, stop and target
- A warning 30 minutes before a release
- Paid Substack letters included
What time is CPI released?
The US Bureau of Labor Statistics (BLS) publishes the Consumer Price Index once a month at 8:30am Eastern time. Its own release notes say so in plain words: the September 2026 report was embargoed until “8:30 a.m. (ET) Wednesday, October 14, 2026”. Here is the same minute in other time zones.
| Where | Winter (Nov to Mar) | Summer (Mar to Oct) |
|---|---|---|
| New York | 08:30 EST | 08:30 EDT |
| London | 13:30 GMT | 13:30 BST |
| UTC | 13:30 | 12:30 |
| Johannesburg | 15:30 SAST | 14:30 SAST |
| India | 19:00 IST | 18:00 IST |
Converted from 8:30am Eastern. For a week or two in March and around the end of October, when the UK and US clocks change on different dates, London is an hour off and the release lands at 12:30 UK time.
That minute sits inside the London and New York overlap, the busiest stretch of the forex day, which is part of why gold’s first reaction can be sharp. The next releases on the BLS schedule are 10 November 2026 (October data), 10 December 2026 (November) and 13 January 2027 (December), each at 8:30am.
What is CPI, and how is it measured?
BLS describes the CPI as “a measure of the average change over time in the prices paid by consumers”. Its collectors record the prices of about 80,000 items each month, from thousands of stores, service businesses, rental units and doctors’ offices across the United States, in person, online or by phone. The main index, CPI-U, covers all urban consumers, which BLS puts at over 90 percent of the US population.
Each release carries two numbers traders watch. Headline CPI is all items. Core CPI is “all items less food and energy”, which some users prefer because food and energy prices swing more. The Desk measures gold against the headline year-on-year figure and the core month-on-month figure, each against its forecast from the TradingView economic calendar.
How does CPI affect gold?
The usual reading: a hotter print than forecast raises the chance that US rates stay high, which tends to lift the dollar and yields, and gold pays no interest, so it often falls. A cooler print works the other way. Some traders argue the opposite, that hot inflation is good for gold as a hedge. On the first 30 minutes, the Desk’s numbers side with the rates reading; over the whole day the picture is mixed, as the paragraph under the table shows. Here is what the Desk measured on gold futures after each release.
| Measure | US CPI | Core CPI |
|---|---|---|
| Releases measured | 23 | 22 |
| Typical first 30 min | 0.24% | 0.21% |
| Typical first 4 hours | 0.51% | 0.49% |
| First move held to close | 12 of 22 | 12 of 21 |
| Hotter: gold fell in 30 min | 3 of 3 median −0.07% | 3 of 4 median −0.05% |
| Cooler: gold rose in 30 min | 7 of 9 median +0.10% | 6 of 10 median +0.08% |
| First-hour range | 0.85% | 0.86% |
| Drift before matched after | 8 of 22 | 8 of 21 |
Source: the Desk’s gold and US CPI page (updated 20 Oct 2026) and gold and core CPI page (updated 8 Nov 2026). Releases since 13 Nov 2024. Typical moves are medians either way; the first-hour range is high to low. COMEX gold futures, mid quotes from intraday bars. Both pages refresh after each release, so the live figures may have moved on.
Three things stand out. The direction mostly follows the surprise, but the size of that early move is small: medians of −0.07% on hotter prints and +0.10% on cooler ones. The move usually keeps going after the first half hour, with the 4-hour move about twice the 30-minute one. And the first reaction held to the close only a little more than half the time, close to a coin flip. Over the longer run, since 20 Jan 2016, gold closed the day higher on 24 of 43 hotter-than-forecast CPI releases and on 32 of 46 cooler ones. That is the whole day, other news included.
What happened on a real CPI day? 14 October 2026
The September 2026 CPI came out on 14 October. BLS reported the all items index up 0.6 percent in the month and 3.7 percent over 12 months. The forecast on the Desk’s page was 3.6%, so it was hotter than forecast. Core rose 0.3% against a 0.2% forecast, also hotter.
Gold fell 1.33% in the first 30 minutes, the largest first-30-minute move of the 23 releases measured. It was down 1.76% after 4 hours and closed the day 1.66% lower. The first move held. Put that in a trade: a long gold position with a stop 0.5% under the price at 8:30 would have been stopped inside the first half hour, because the move was more than twice that distance. A stop beyond the typical 0.85% first-hour range would also have gone on this day. That is the case for deciding before the print whether a trade can carry the risk at all.
Now the other side. On 10 June 2026 the May CPI was in line at 4.2%, and gold moved 0.00% in the first 30 minutes, then closed the day 3.57% lower. On 14 July 2026 the June CPI came in cooler, 3.5% against 3.8%, and gold rose 1.13% in the first 30 minutes and 1.60% on the day. The print sets the tone; it does not promise the day.
| Release (data month) | Actual vs forecast | First 30 min | First 4 hours | Release day |
|---|---|---|---|---|
| 14 Oct 2026 (Sep) | 3.7% vs 3.6%, hotter | −1.33% | −1.76% | −1.66% |
| 11 Sep 2026 (Aug) | 3.4% vs 3.4%, in line | +1.07% | +0.29% | +0.04% |
| 12 Aug 2026 (Jul) | 3.4% vs 3.4%, in line | +0.24% | −0.09% | +0.59% |
| 14 Jul 2026 (Jun) | 3.5% vs 3.8%, cooler | +1.13% | +0.86% | +1.60% |
| 10 Jun 2026 (May) | 4.2% vs 4.2%, in line | 0.00% | −0.41% | −3.57% |
| 12 May 2026 (Apr) | 3.8% vs 3.7%, hotter | −0.02% | −0.87% | −0.89% |
| 10 Apr 2026 (Mar) | 3.3% vs 3.3%, in line | +0.07% | −0.13% | −0.64% |
| 11 Mar 2026 (Feb) | 2.4% vs 2.4%, in line | −0.27% | −0.29% | −1.20% |
| 13 Feb 2026 (Jan) | 2.4% vs 2.5%, cooler | +0.34% | +0.80% | +1.98% |
| 13 Jan 2026 (Dec) | 2.7% vs 2.7%, in line | +0.39% | +0.45% | −0.34% |
| 18 Dec 2025 (Nov) | 2.7 vs 3.1, cooler | +0.36% | +0.96% | −0.21% |
| 24 Oct 2025 (Sep) | 3% vs 3.1%, cooler | +0.51% | +1.74% | −0.19% |
The last 12 US CPI releases, headline year-on-year, as shown on /reactions/gold-cpi (updated 20 Oct 2026). Release day runs from the close the day before to the close of the release day.
What is the best CPI gold strategy for a swing trader?
For a swing trade that lasts days, the release is a risk to manage, not a trade to take. This is how I run CPI week.
- Sunday: find the date. Check the calendar, and note which open or planned trades are gold or a US dollar pair. Those are the ones CPI touches.
- Size the stop against the noise. The typical first-hour range has been 0.85%. A stop closer than that to the price at the print has usually been reached by the release alone. Use a stop beyond structure with an ATR distance, or keep the trade off until it lands.
- Do not read the run-in. The 4 hours before the print drifted the same way as the move after it on only 8 of 22 releases.
- Do not chase the first 30 minutes. The first move held to the close on 12 of 22. Spreads also widen at the print, so a real order can fill worse than the chart.
- Read the print against the forecast, then wait. The 4-hour move has typically been about twice the first half hour. A pending entry that the spike fills deserves a second look before you treat it as a normal fill.
The news calendar playbook is the Desk’s version of this list: it flags the releases that touch the markets you follow, warns you 30 minutes before by push and email, and reads the print against the forecast straight after. For stops in general, see how to set a stop loss for swing trading.
The free letter covers method, markets and the release weeks that matter.
CPI vs core CPI: which moves gold more?
Both numbers come out in the same release at the same minute, so gold reacts to the pair, not to one alone. Measured separately, the typical first-30-minute move was 0.24% against headline CPI and 0.21% against core, and many rows are the same day’s move filed under each. The useful difference is when they disagree. On 11 September 2026 headline CPI was in line at 3.4% while core came in hotter, 0.3% against 0.2%, and gold rose 1.07% in the first 30 minutes anyway. Read both before deciding what the print “was”.
What to do this week
- Release: Tue 10 Nov 2026, 8:30 ET (13:30 UK)
- Check every gold and USD trade before it
- Stops tighter than 0.85%: widen, or stand aside
- Next after that: 10 Dec 2026 and 13 Jan 2027
Walk into the next CPI with the levels already set
Every Sunday before the open: analysed swing setups across stocks, forex, gold and crypto with the exact entry, stop and target, an alert when one triggers, a warning before the releases that touch them, and the paid Substack letters.
Get the annual, 20% off →FAQ
What time is CPI released in the UK?
US CPI comes out at 8:30am Eastern time, which is 13:30 in the UK for most of the year. For a week or two in March and around the end of October, when the UK and US clocks change on different dates, it lands at 12:30 UK time.
Does gold go up or down on CPI?
It depends on the surprise. On the Desk’s measured history, gold fell in the first 30 minutes on 3 of 3 releases that came in hotter than forecast, and rose on 7 of 9 that came in cooler. In-line prints have gone either way.
How much does gold move on CPI?
Over the last 23 US CPI releases the median first-30-minute move was 0.24% and the median 4-hour move was 0.51%. The largest first-30-minute move was −1.33%, on 14 October 2026.
Does headline CPI or core CPI matter more for gold?
Both come out in the same release at the same minute, so gold reacts to the pair. Measured separately, the typical first-30-minute move was 0.24% for headline CPI and 0.21% for core, close enough that a swing trader should read both.
Should a swing trader trade the CPI spike?
I do not. The first move held to the close on only 12 of 22 releases, and spreads widen at the print. I set levels before the release, keep stops wider than the typical 0.85% first-hour range, or stay flat until it lands.
Sources
- BLS, Schedule of releases for the Consumer Price Index (release dates and 08:30 AM time, read 9 Nov 2026)
- BLS, Consumer Price Index news release, September 2026 (embargo time, 0.6% and 3.7%, read 9 Nov 2026)
- BLS, CPI frequently asked questions (definition, about 80,000 items, CPI-U coverage, core)
- RB Trading, How does gold react to US CPI? (updated 20 Oct 2026)
- RB Trading, How does gold react to US core CPI? (updated 8 Nov 2026)
- TradingView economic calendar (the forecasts the reaction pages use)
Educational analysis, not financial advice. Trading carries a risk of loss, and past reactions do not promise future ones.