The S&P 500 this week: the trend, the typical range and the events
The S&P 500 was at 7,416.59 on 17 Nov 2026, with a mixed daily EMA stack and a mixed weekly one. A typical week has moved 174 points (2.3%), the weekly ATR over the last 14 completed weeks. This week has 4 high-impact USD releases, starting with US Fed Chairman Warsh Speaks on Mon 16 Nov at 12:00 New York.
- The S&P 500's read for the week, posted before the open
- Entry, stop and target when there is a setup
- An alert the moment a level hits
- Every loss published on the record
This page never shows the plan or its direction. Members see it in the Desk.
- The news calendar, in your time zone
- The same live charts, free
- Email only, no card
- The weekly plan and the alerts
- Paid Substack letters included
- $199 a year, not $249: about 55¢ a day
Where is the S&P 500 this week?
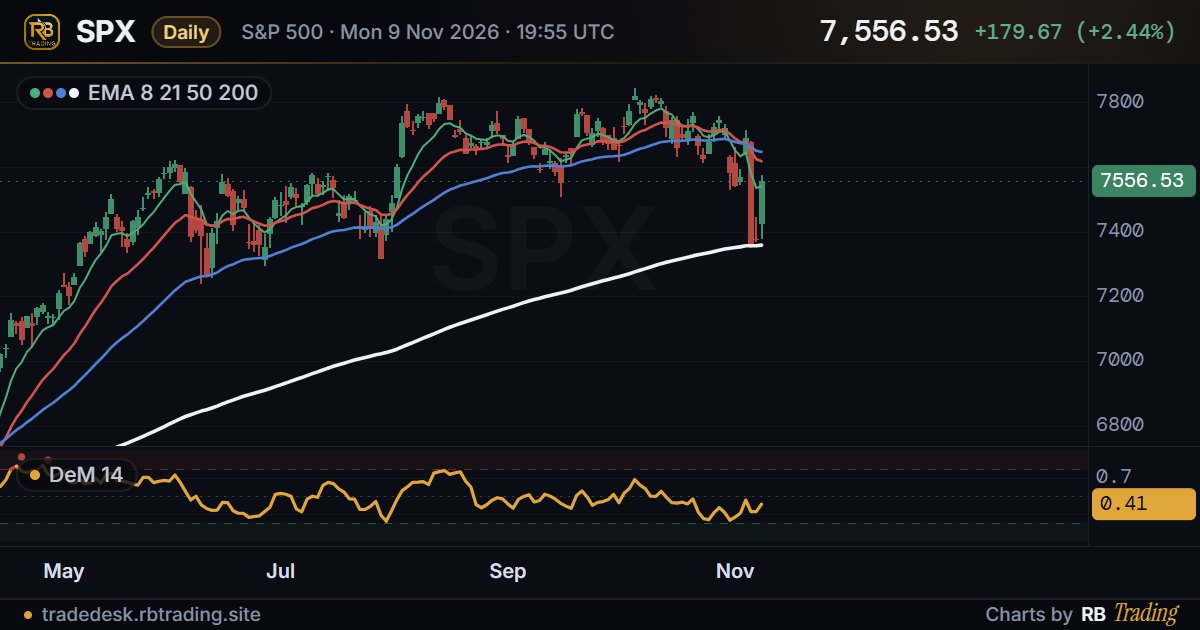
Daily: mixed, price above the 200, below the 8, 21 and 50. Weekly: mixed, price above the 50 and 200, below the 8 and 21. The table has each line and how far price sits from it.
| Line | Daily | Weekly |
|---|---|---|
| EMA 8 | 7,529.67 price −1.5% | 7,550.56 price −1.8% |
| EMA 21 | 7,586.60 price −2.2% | 7,540.34 price −1.6% |
| EMA 50 | 7,626.76 price −2.8% | 7,271.34 price +2.0% |
| EMA 200 | 7,367.14 price +0.7% | 6,037.48 price +22.8% |
What news moves the S&P 500 this week?
This week has 4 high-impact USD releases, starting with US Fed Chairman Warsh Speaks on Mon 16 Nov at 12:00 New York, then US Retail Sales m/m on Tue 17 Nov at 08:30 New York, then US FOMC Meeting Minutes on Wed 18 Nov at 14:00 New York. Times are New York and UK local time, for the week of 16 to 20 Nov 2026.
| Day (New York) | Release | New York | UK | Figure | Measured reaction |
|---|---|---|---|---|---|
| Mon 16 Nov | US Fed Chairman Warsh Speaks | 12:00 | 17:00 | no forecast | no page yet |
| Tue 17 Nov | US Retail Sales m/m | 08:30 | 13:30 | 0.1% forecast | S&P 500 after it |
| Tue 17 Nov | US Core Retail Sales m/m | 08:30 | 13:30 | 0.4% forecast | no page yet |
| Wed 18 Nov | US FOMC Meeting Minutes | 14:00 | 19:00 | no forecast | no page yet |
How much does the S&P 500 move after US Retail Sales m/m?
On the last 23 releases of US Retail Sales m/m, the S&P 500 moved a median 0.09% in the first 30 minutes and 0.31% over the first 4 hours, either way (the full history). That is the noise a stop placed before the print has to sit through.
The S&P 500 is 22.8% above its 200-week EMA (6,037.48), on the Desk's weekly chart. For the fund, see SPY, the S&P 500 ETF against its 200-week EMA.
An old winner on the S&P 500
One closed trade from the Desk's record on this market, as the record shows it. It is history, not this week's plan.
MES long, opened 6 May 2026 and closed 6 May 2026: entry 7,341.25, stop 7,324.08, exit 7,367, closed by hand in profit. +1.50R.
Every closed trade, losses included, is on the published record.
FAQ
Will the S&P 500 go up or down this week?
Nobody can know that in advance, and this page does not guess. On 17 Nov 2026 the S&P 500 was at 7,416.59, with the daily EMA stack mixed (price above the 200, below the 8, 21 and 50) and the weekly mixed (price above the 50 and 200, below the 8 and 21). That is the trend context a plan starts from, not a prediction.
How much does the S&P 500 move in a week?
The average true range of its last 14 completed weekly candles is 174 points (2.3%). A week that moves much more than that is unusual; one that moves much less is quiet.
What news moves the S&P 500 this week?
This week has 4 high-impact USD releases, starting with US Fed Chairman Warsh Speaks on Mon 16 Nov at 12:00 New York, then US Retail Sales m/m on Tue 17 Nov at 08:30 New York, then US FOMC Meeting Minutes on Wed 18 Nov at 14:00 New York.
How far is the S&P 500 from its 200-week EMA?
The S&P 500 is 22.8% above its 200-week EMA, which is at 6,037.48.
Does the Trade Desk post a the S&P 500 trade this week?
The Desk posts its read on the S&P 500 before the week opens, with the entry, stop and target when there is a setup, and sends an alert when a level hits. Those levels are for members, so this page never shows an open trade or its direction. Every closed trade, losses included, is on the public record.
Sources
- Prices, EMAs and the weekly range: the Trade Desk's chart feed (Yahoo candles), the same candles the free section's charts draw. The weekly chart on TradingView.
- The week's releases: the Desk's news calendar, from the ForexFactory calendar and the TradingView economic calendar.
- The moves after releases: the Desk's measured release history (every release reaction), mid quotes from intraday bars, not broker fills.
- The 200-week EMA touches: the Desk's 200-week EMA scan, read twice a day.
- The closed trade: the published record, every closed trade, winners and losers.
The week's plan for the S&P 500, before the open
Start free for the news calendar and the live charts. The annual adds the weekly plan with entry, stop and target, and an alert the moment a level hits.
Open the free section →